62 63
Contour
®
next blood glucose monitoring system
TECHNICAL INFORMATION
Table 3: System accuracy results for glucose concentrations from
1.9 mmol/L to 29.1 mmol/L
Within ± 0.83 mmol/L or ± 15%
600 of 600 (100%)
Acceptance criterion in ISO 15197:2013 is that 95% of the measured
glucose values shall fall within either ± 0.83 mmol/L of the average
measured values of the reference measurement procedure at
glucose concentrations < 5.55 mmol/L or within ± 15% at glucose
concentrations ≥ 5.55 mmol/L.
User Accuracy
A study evaluating glucose values from ngertip capillary blood
samples obtained by 324 lay persons showed the following results:
100% within ± 0.83 mmol/L of the medical laboratory values at glucose
concentrations < 5.55 mmol/L and 98.60% within ± 15% of the medical
laboratory glucose concentrations ≥ 5.55 mmol/L.
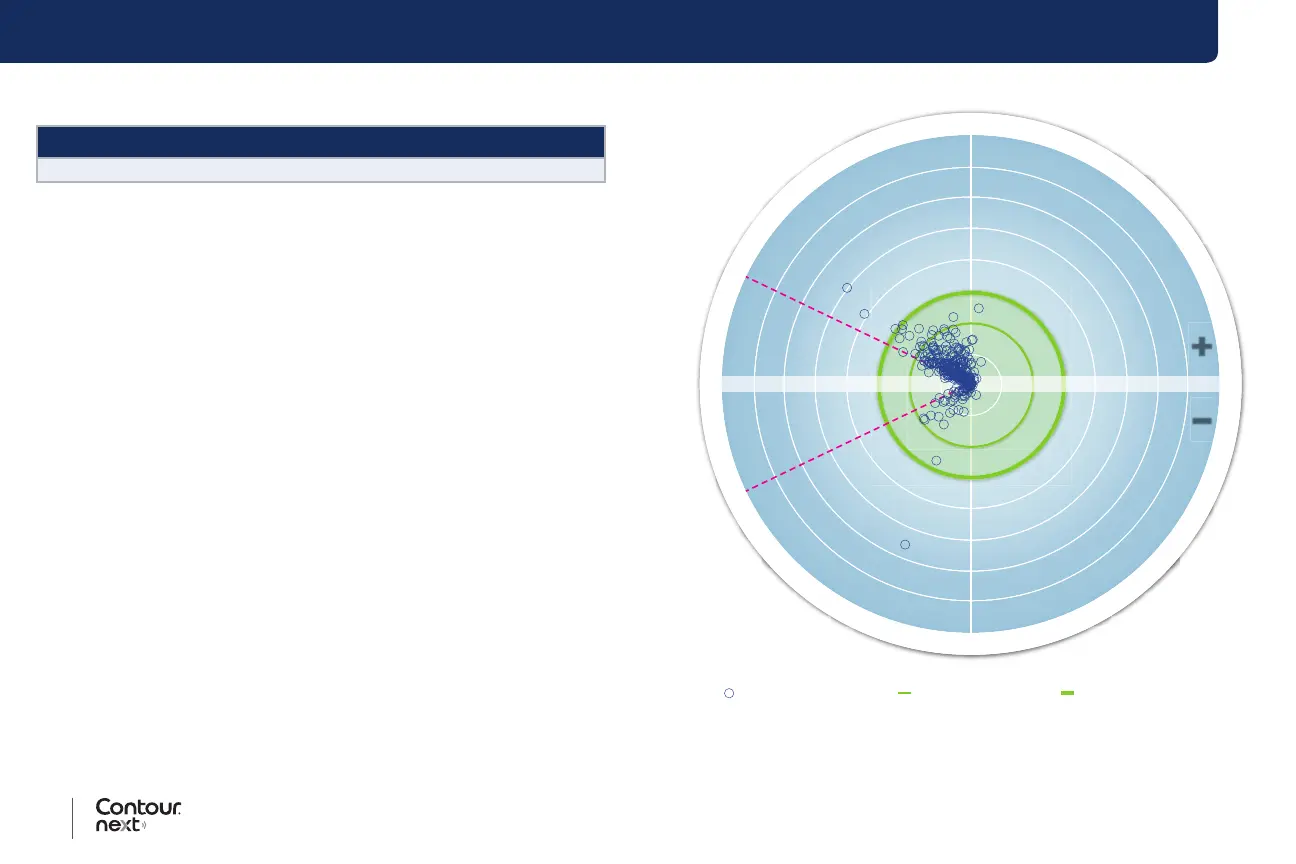
User Accuracy Radar Plot
1.7
mmol/L
>1.9
mmol/L
1.1
mmol/L
1.4
mmol/L
0.8
mmol/L
0.6
mmol/L
0.3
mmol/L
2
0
.
0
3
3
.
3
0
.
8
1
6
.
1
2
0
.
0
1
6
.
1
1
1
.
1
2
3
.
7
2
7
.
8
Y
S
I
®
(
m
m
o
l
/
L
)
5
.
6
2
3
.
7
1
1
.
1
5
.
6
2
7
.
8
10% 20% 30% >35%5% 15% 25%
+
–
All samples (n = 324) 0.8 mmol/L or 15%0.6 mmol/L or 10%
The 324 data points represent the blood glucose monitoring system
(BGMS) results. The distance from the centre represents the
magnitude of the error compared with the laboratory reference result.