64 65
Contour
®
next blood glucose monitoring system
TECHNICAL INFORMATION
If a data point is at the centre, there is zero error, which means the
BGMS reading is identical to the laboratory value.
The data points inside the bold green outer circle represent readings
within ± 0.83 mmol/L for values < 5.55 mmol/L or ± 15% error for
values ≥ 5.55 mmol/L versus laboratory reference to demonstrate how
the BGMS compares to the ISO 15197:2013 accuracy requirements.
Technical Information: Precision
A measurement repeatability study was conducted with the
Contour next blood glucose monitoring system using 5 venous
whole blood specimens with glucose levels from 2.2 mmol/L
to 19.3 mmol/L. With each blood specimen, each of 3 lots of
Contour next test strips was tested 10 times on each of
10 instruments for a total of 300 readings. The following precision
results were obtained.
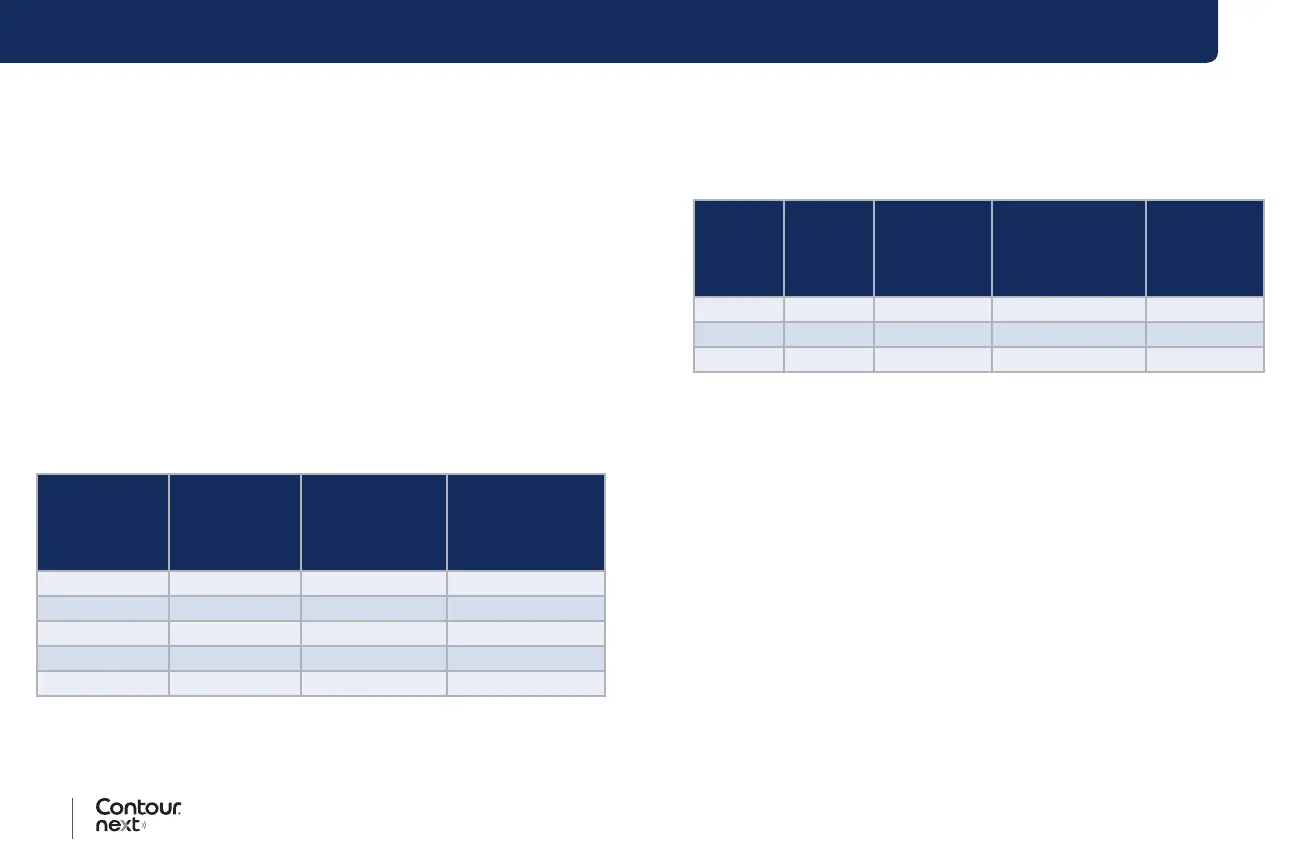
Table 1: System repeatability results for
Contour next meter
using Contour next test strips
Mean,
mmol/L
Pooled
Standard
Deviation,
mmol/L
95% CI of SD,
mmol/L
Coecient of
Variation, %
2.23 0.06 0.058–0.068 2.8
4.36 0.07 0.067–0.079 1.7
7.63 0.11 0.102–0.121 1.5
11.80 0.18 0.170–0.202 1.6
18.94 0.24 0.223–0.264 1.3
Intermediate measurement precision (which includes variability across
multiple days) was evaluated using control solutions at 3 glucose
levels. With each control solution, each of 3 lots of
Contour next
test strips was tested once on each of 10 instruments on 10 separate
days for a total of 300 readings. The following precision results were
obtained.
Table 2: System intermediate precision results for
Contour next
meter using Contour next test strips
Control
Level
Mean,
mmol/L
Pooled
Standard
Deviation,
mmol/L
95% CI of SD,
mmol/L
Coecient
of Variation,
%
Low 2.34 0.03 0.032–0.038 1.5
Normal 6.99 0.10 0.096–0.113 1.5
High 20.53 0.38 0.352–0.417 1.9
Symptoms of High or Low Blood Glucose
You can better understand your test results by being aware of
the symptoms of high or low blood glucose. According to the
American Diabetes Association (www.diabetes.org), some of the most
common symptoms are:
Low blood glucose (Hypoglycaemia):
• shakiness
• sweating
• fast heartbeat
• blurred vision
• confusion
• passing out
• seizure
• irritability
• extreme hunger
• dizziness

 Loading...