VLT
®
HVAC Drive FC 102
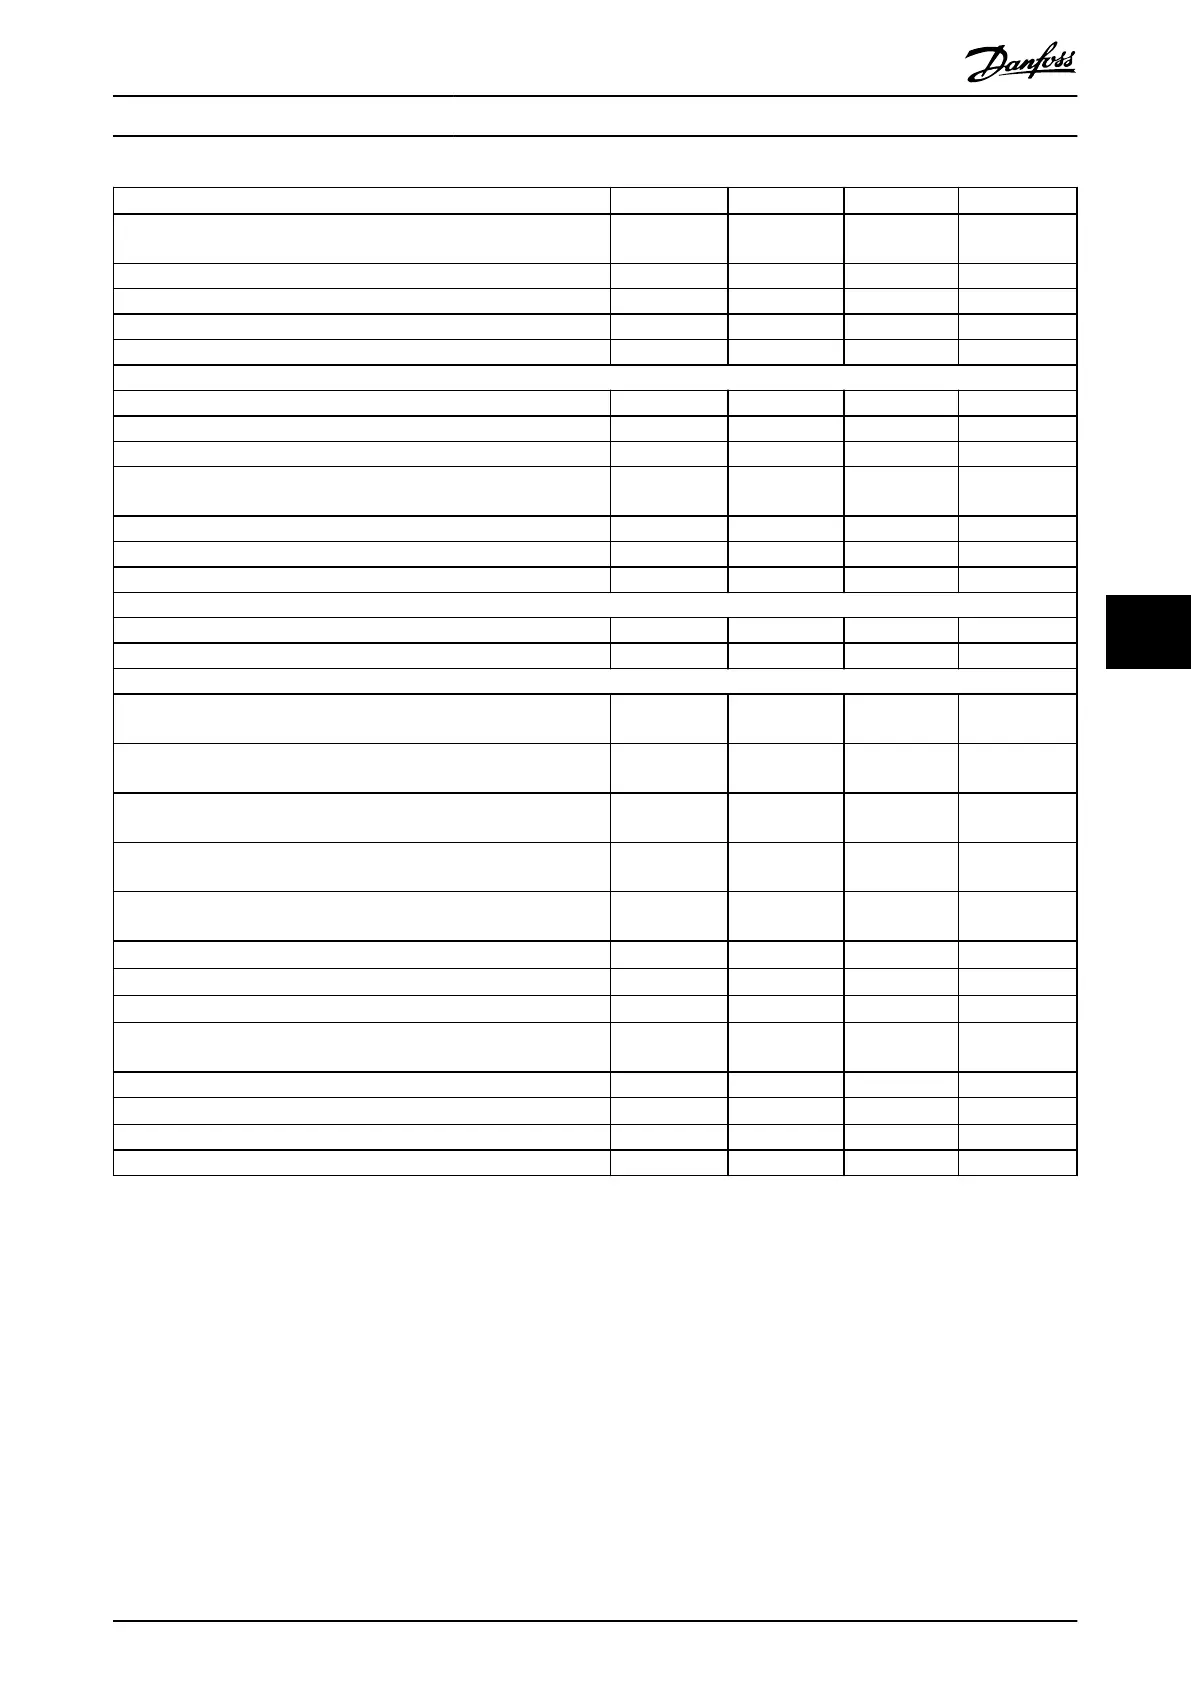
P500 P560 P630 P710
Normal overload NO NO NO NO
(Normal overload=110% current during 60 s)
Typical shaft output at 400 V [kW] 500 560 630 710
Typical shaft output at 460 V [hp] 650 750 900 1000
Typical shaft output at 480 V [kW] 560 630 710 800
Enclosure size F1/F3 F1/F3 F1/F3 F1/F3
Output current (3-phase)
Continuous (at 400 V) [A] 880 990 1120 1260
Intermittent (60 s overload) (at 400 V) [A] 968 1089 1680 1890
Continuous (at 460/480 V) [A] 780 890 1050 1160
Intermittent (60 s overload)
(at 460/480 V) [A]
858 979 1155 1276
Continuous kVA (at 400 V) [kVA] 610 686 776 873
Continuous kVA (at 460 V) [kVA] 621 709 837 924
Continuous kVA (at 480 V) [kVA] 675 771 909 1005
Maximum input current
Continuous (at 400 V) [A] 848 954 1079 1214
Continuous (at 460/480 V) [A] 752 858 1012 1118
Maximum number and size of cables per phase
- Motor [mm
2
(AWG)]
8x150 (8x300
mcm)
8x150 (8x300
mcm)
8x150 (8x300
mcm)
8x150 (8x300
mcm)
- Mains [mm
2
(AWG)] (F1)
8x240 (8x500
mcm)
8x240 (8x500
mcm)
8x240 (8x500
mcm)
8x240 (8x500
mcm)
- Mains [mm
2
(AWG)] (F3)
8x456 (8x900
mcm)
8x456 (8x900
mcm)
8x456 (8x900
mcm)
8x456 (8x900
mcm)
- Load share [mm
2
(AWG)]
8x120 (8x250
mcm)
8x120 (8x250
mcm)
8x120 (8x250
mcm)
8x120 (8x250
mcm)
- Brake [mm
2
(AWG)]
8x185 (8x350
mcm)
8x185 (8x350
mcm)
8x185 (8x350
mcm)
8x185 (8x350
mcm)
Maximum external mains fuses [A]
1)
1600 1600 2000 2000
Estimated power loss at 400 V [W]
2), 3)
10162 11822 12512 14674
Estimated power loss at 460 V [W]
2), 3)
8876 10424 11595 13213
Maximum added losses A1 RFI, circuit breaker or disconnect, and
contactor [W], (F3 only)
963 1054 1093 1230
Maximum panel options losses [W] 400 400 400 400
Eciency
3)
0.98 0.98 0.98 0.98
Output frequency [Hz] 0–590 0–590 0–590 0–590
Control card overtemperature trip [°C (°F)]
85 (185) 85 (185) 85 (185) 85 (185)
Table 7.2 Electrical Data for Enclosures F1/F3, Mains Supply 3x380–480 V AC
1) For fuse ratings, see chapter 10.5 Fuses and Circuit Breakers.
2) Typical power loss is at normal conditions and expected to be within
±
15% (tolerance relates to variety in voltage and cable conditions). These
values are based on a typical motor eciency (IE/IE3 border line). Lower eciency motors add to the power loss in the drive. Applies for
dimensioning of drive cooling. If the switching frequency is higher than the default setting, the power losses can increase. LCP and typical control
card power consumptions are included. For power loss data according to EN 50598-2, refer to drives.danfoss.com/knowledge-center/energy-
eciency-directive/#/. Options and customer load can add up to 30 W to the losses, though usually a fully loaded control card and options for
slots A and B each add only 4 W.
3) Measured using 5 m (16.5 ft) shielded motor cables at rated load and rated frequency. Eciency measured at nominal current. For energy
eciency class, see chapter 10.12 Eciency. For part load losses, see drives.danfoss.com/knowledge-center/energy-eciency-directive/#/.
Specications Design Guide
MG16C302 Danfoss A/S © 11/2017 All rights reserved. 49
7 7
 Loading...