2.7.3 Example of Energy Savings
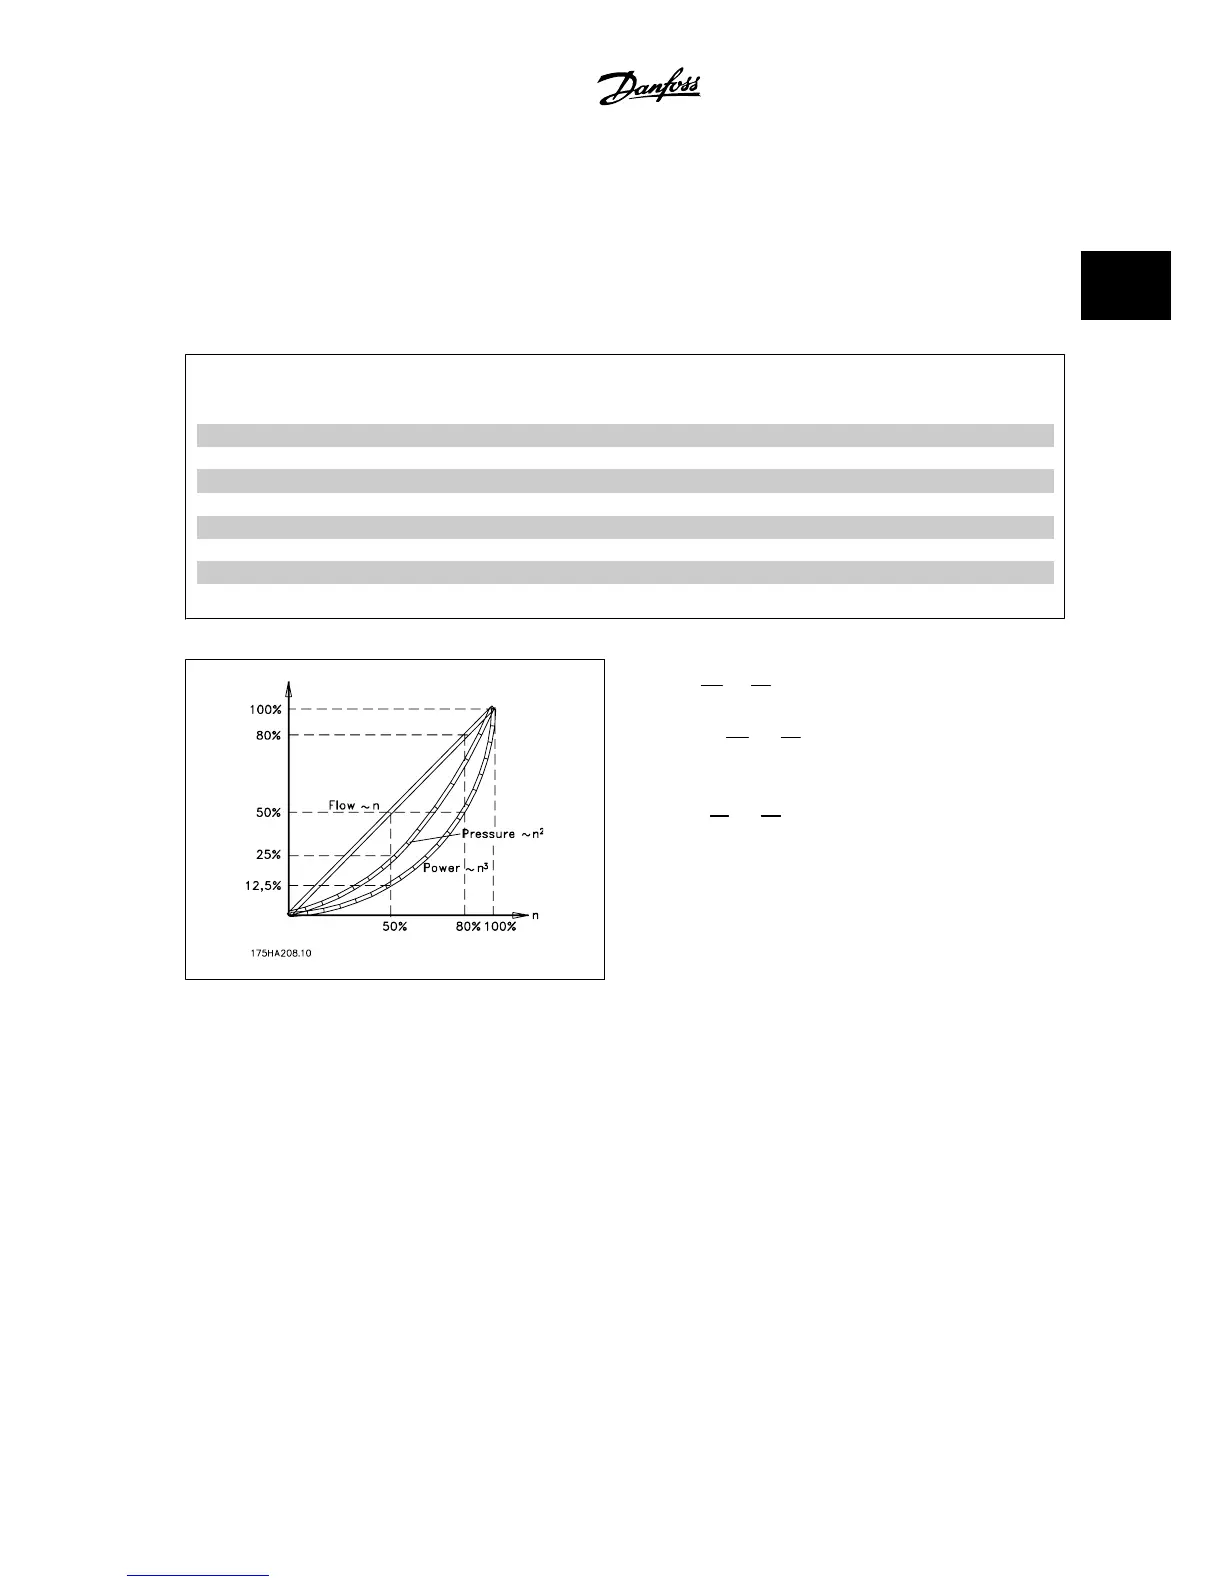
As can be seen from the figure (the laws of proportionality), the flow is controlled by changing the RPM. By reducing the rated speed by only 20%, the
flow is also reduced by 20%. This is because the flow is directly proportional to the RPM. The consumption of electricity, however, is reduced by 50%.
If the system in question only needs to be able to supply a flow corresponding to 100% a few days each year, while the average is below 80% of the
rated flow for the remainder of the year, the amount of energy saved is even greater than 50%.
The laws of proportionality
The figure below describes the dependence of flow, pressure and power consumption on RPM.
Q = Flow P = Power
Q
1
= Rated flow P
1
= Rated power
Q
2
= Reduced flow P
2
= Reduced power
H = Pressure n = Speed regulation
H
1
= Rated pressure n
1
= Rated speed
H
2
= Reduced pressure n
2
= Reduced speed
Flow
:
Q
1
Q
2
=
n
1
n
2
Pressure
:
H
1
H
2
=
(
n
1
n
2
)
2
Power
:
P
1
P
2
=
(
n
1
n
2
)
3
2.7.4 Example with Varying Flow over 1 Year
The example below is calculated on the basis of pump characteristics ob-
tained from a pump datasheet.
The result obtained shows energy savings in excess of 50% at the given
flow distribution over a year. The pay back period depends on the price
per kwh and the price of the adjustable frequency drive. In this example,
it is less than a year when compared with valves and constant speed.
VLT
®
AQUA Drive Design Guide 2 Introduction to the VLT AQUA Drive
MG.20.N5.22 - VLT
®
is a registered Danfoss trademark
2-7
2
 Loading...