DRAFT 20 June 2005
Jaundice Meter Instructions for Use (MU01380) Page B - 5
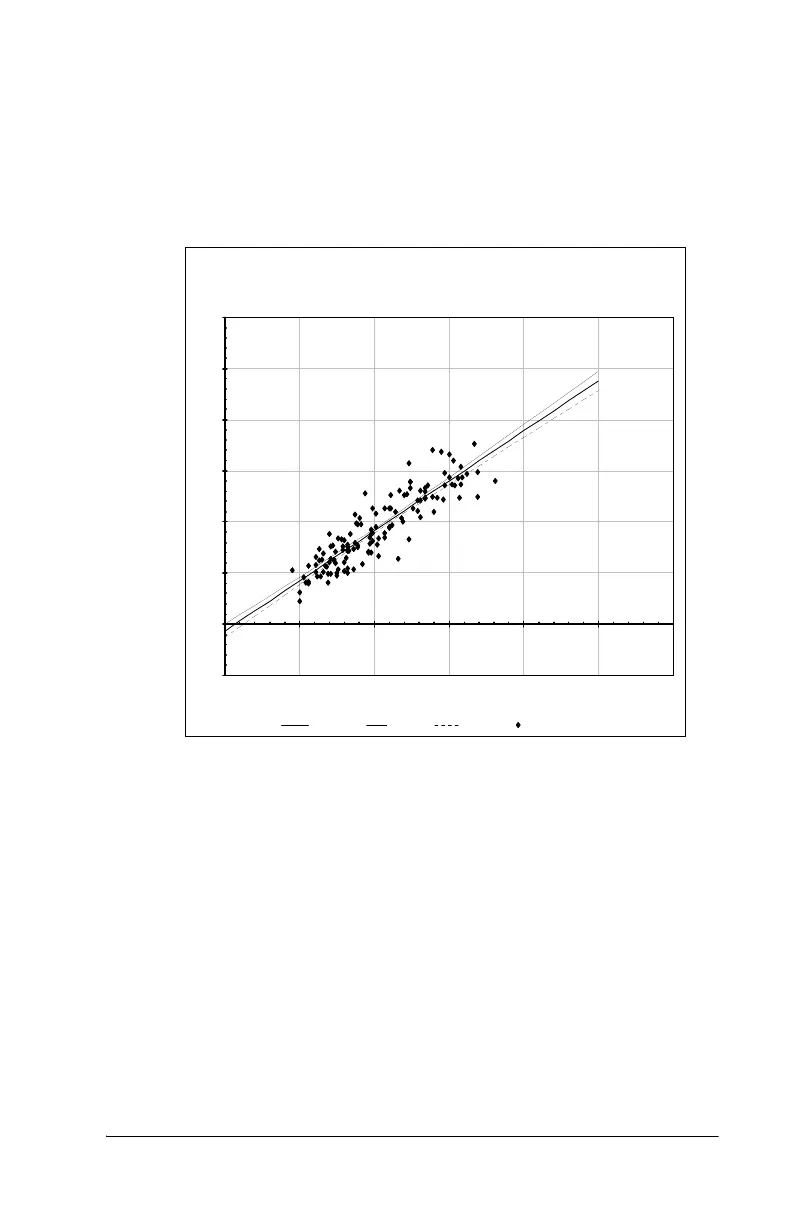
Graph 3 – Regression Analysis, Doctors’ Office #1
JM-103 Regression Analysis
Doctor's office No.1
-5
0
5
10
15
20
25
30
0 5 10 15 20 25 30
Serum Bilirubin TSB (mg/dl)
JM-103 Reading TcB Mg/dl
Regression Line Upper Limit Low er Limit Data Points
Regression Analysis Statistics Sample Size (n) = 133.
Y = -0.636 + 0.977 X
Root Mean Square Error (MSE) = 1.572
R-Square = 0.804
95% Confidence Interval (CI) for the Intercept = (-1.526, 0.254)
95% CI for the Slope = (0.894, 1.061)