DRAFT 20 June 2005
Page B - 6 Jaundice Meter Instructions for Use (MU01380)
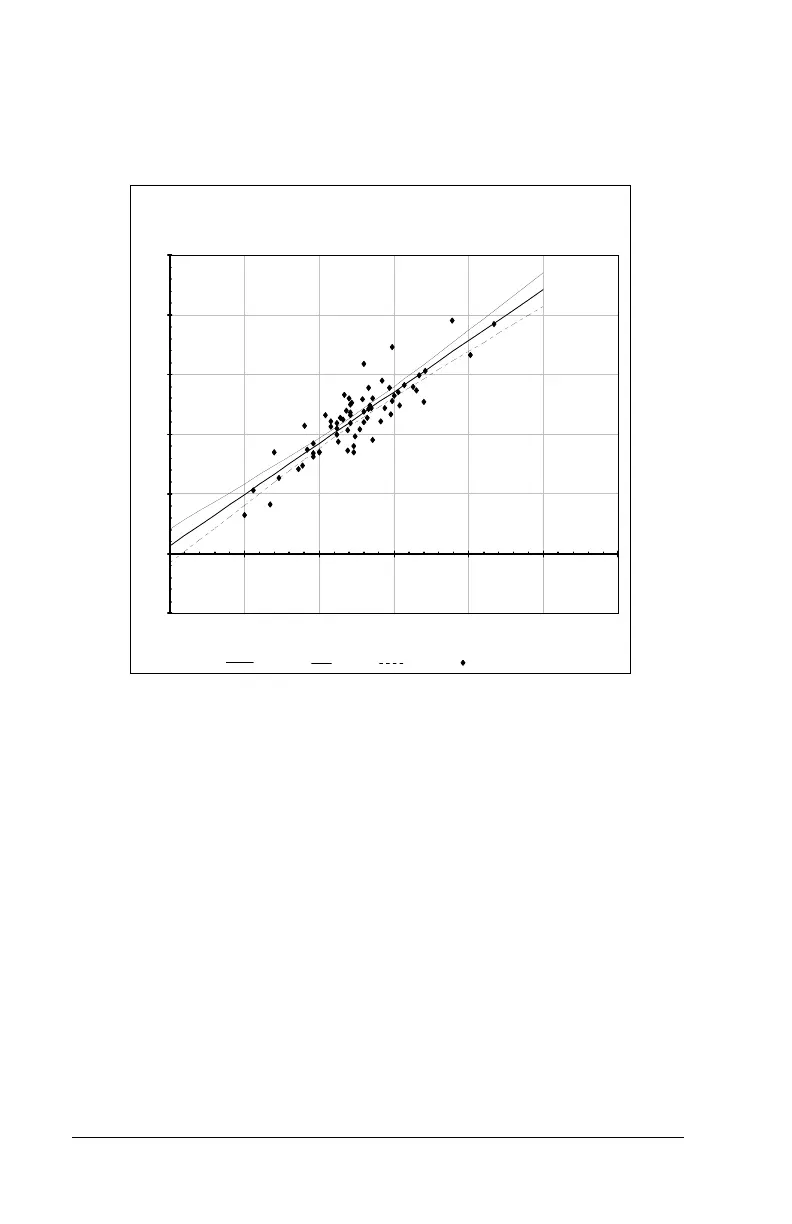
Graph 4 – Regression Analysis, Doctors’ Office #2
JM-103 Regression Analysis
Doctor's Office No.2
-5
0
5
10
15
20
25
0 5 10 15 20 25 30
Serum Bilirubin TSB (mg/dl)
JM-103 Reading TcB Mg/dl
Regression Line Upper Limit Low er Limit Data Points
Regression Analysis Statistics Sample Size = 68
Y = 0.646 +0.859 X
Root MSE = 1.475
R-Square = 0.769
95% CI for the Intercept = (-0.846, 2.138)
95% CI for the Slope = (0.743, 0.974)