DRAFT 20 June 2005
Jaundice Meter Instructions for Use (MU01380) Page B - 7
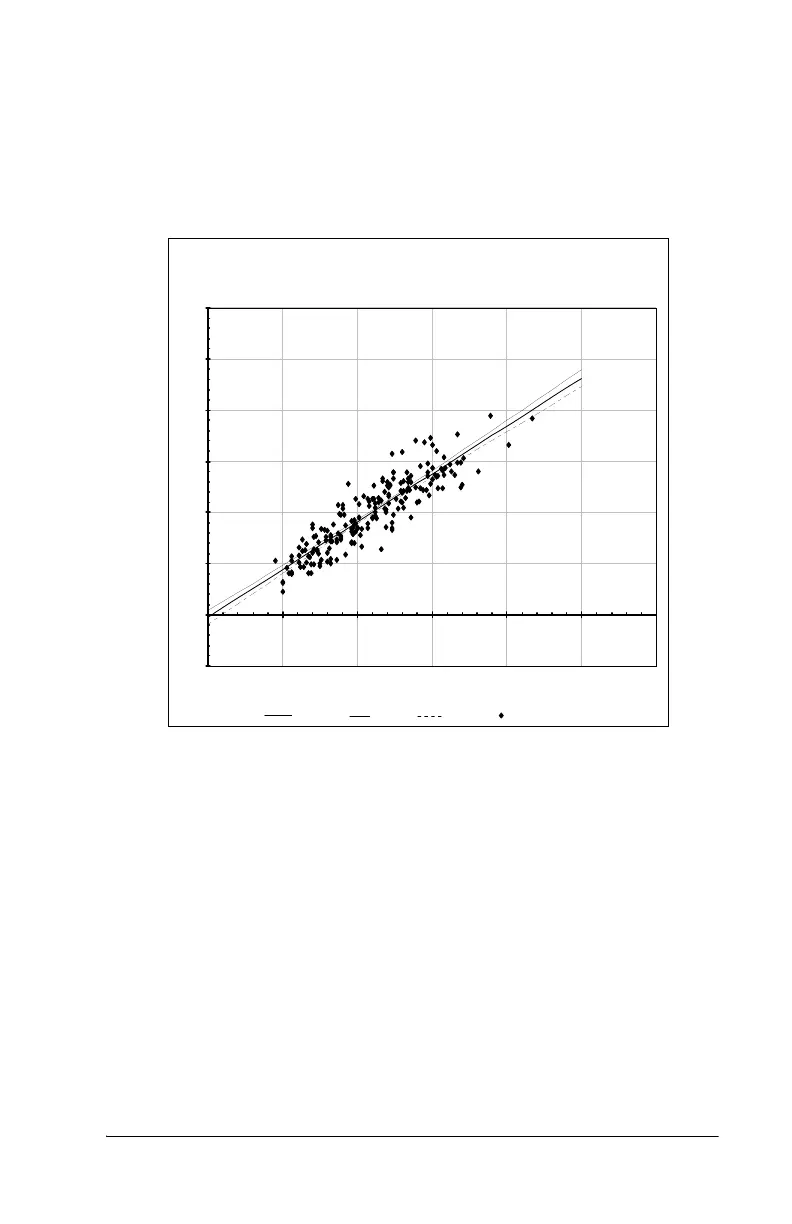
Graph 5 – Regression Analysis, Doctors’ Office Setting, 2 Locations
JM-103 Regression Analysis
Doctor's office setting - 2 locations
-5
0
5
10
15
20
25
30
0 5 10 15 20 25 30
Serum Bilirubin TSB (mg/dl)
JM-103 Measurement Mg/dl
Regression Line Upper Limit Low er Limit Data Points
Regression Analysis Statistics Sample Size = 201
Y = 0.233 +0.934 X
Root MSE = 1.54
R-Square = 0.899
95% CI for the Intercept = (-0.233, 0.37)
95% CI for the Slope = (0.934, 0.032)