Leaders in Pipeline Survey Systems
OPERATOR’S MANUAL
Issue 4.04 - 1207 19
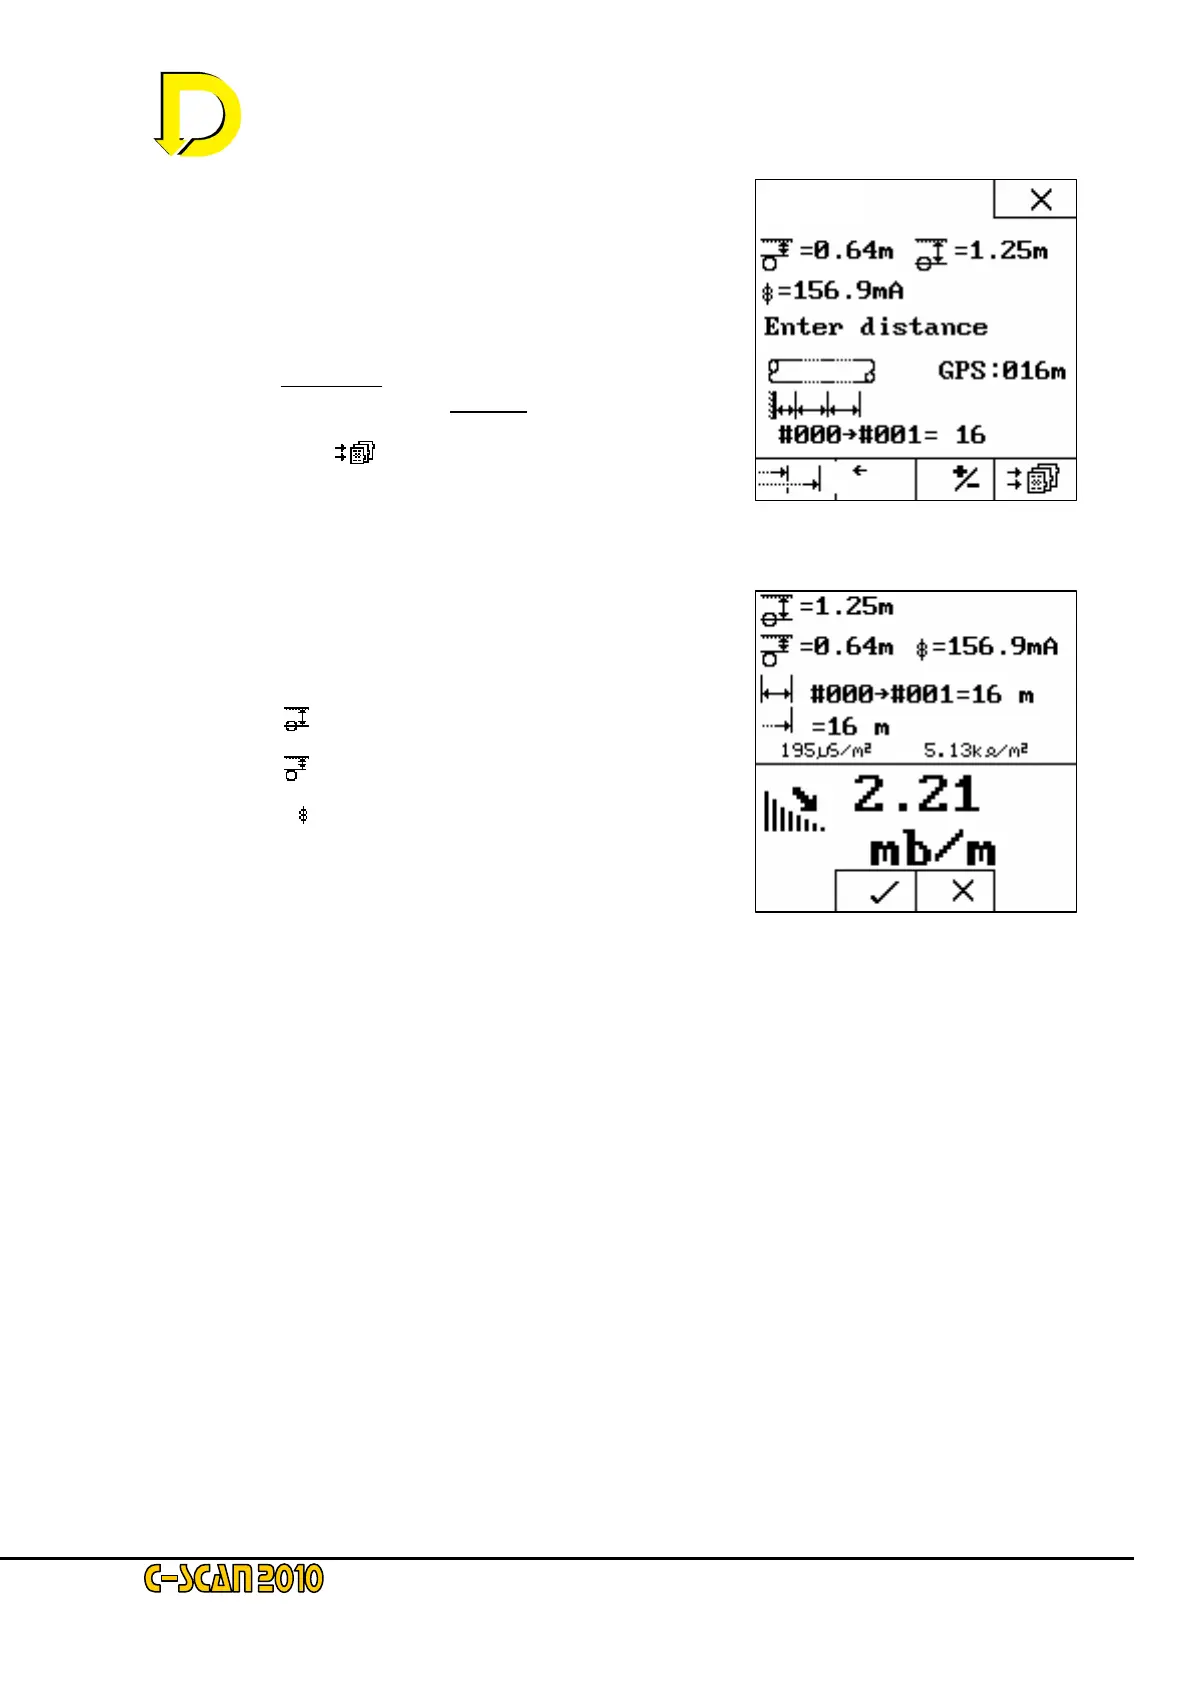
Fig. 21 – Distance Screen 3
Fig. 20 – Distance Screen 2
The distance from the start point (#000→#001) is now
entered as 16m – see Fig 20 right.
NOTE: you may change your mind at this point and enter the
distance manually by pressing they key below the go-back arrow
box (←).
The +/- box key is used to change direction; POSITIVE (+ve)
distances are away from
the Signal Generator (SG) –
NEGATIVE (-ve) distances are towards
the SG.
Press the STORE [
] key now.
This is the final screen before the data
is permanently stored.
Data now on display – see Fig. 21 right –
is as before:
• Depth
• Cover
• Current
• Distance │↔│(16m)
• This Point (#001)
• Last Point (#000)
• Chainage →│(16m)
Plus newly displayed data on this screen:
• CONDUCTANCE (µS/m
2
– micro-siemens per sq.metre
• RESISTANCE (kΏ/ m
2
– kilohms per sq.metre
these relate to the coating condition allowing for pipe diameter and wall thickness.
and finally - ATTENUATION
The attenuation value (mb/m or mb/ft) is the absolute rate of loss of signal current from, the
pipeline over the section #000 - #001. It is independent of the value of the initial signal set on
the signal generator and of the ground conditions. It is solely determined by the average
condition of the coating between the two locations and by the area of pipeline coating in contact
with the ground, per metre (or per foot) of pipeline – or in other words: the pipeline diameter.
For a pipeline of a given diameter, the attenuation value is an absolute indicator of wrap
condition; the lower the figure, the better. If comparing two pipelines of different diameters but
with identical wrap condition, the attenuation values will be proportional to the diameter.
Press the 9 key now to continue.
 Loading...

