Leaders in Pipeline Survey Systems
OPERATOR’S MANUAL
Issue 4.04 - 1207 30
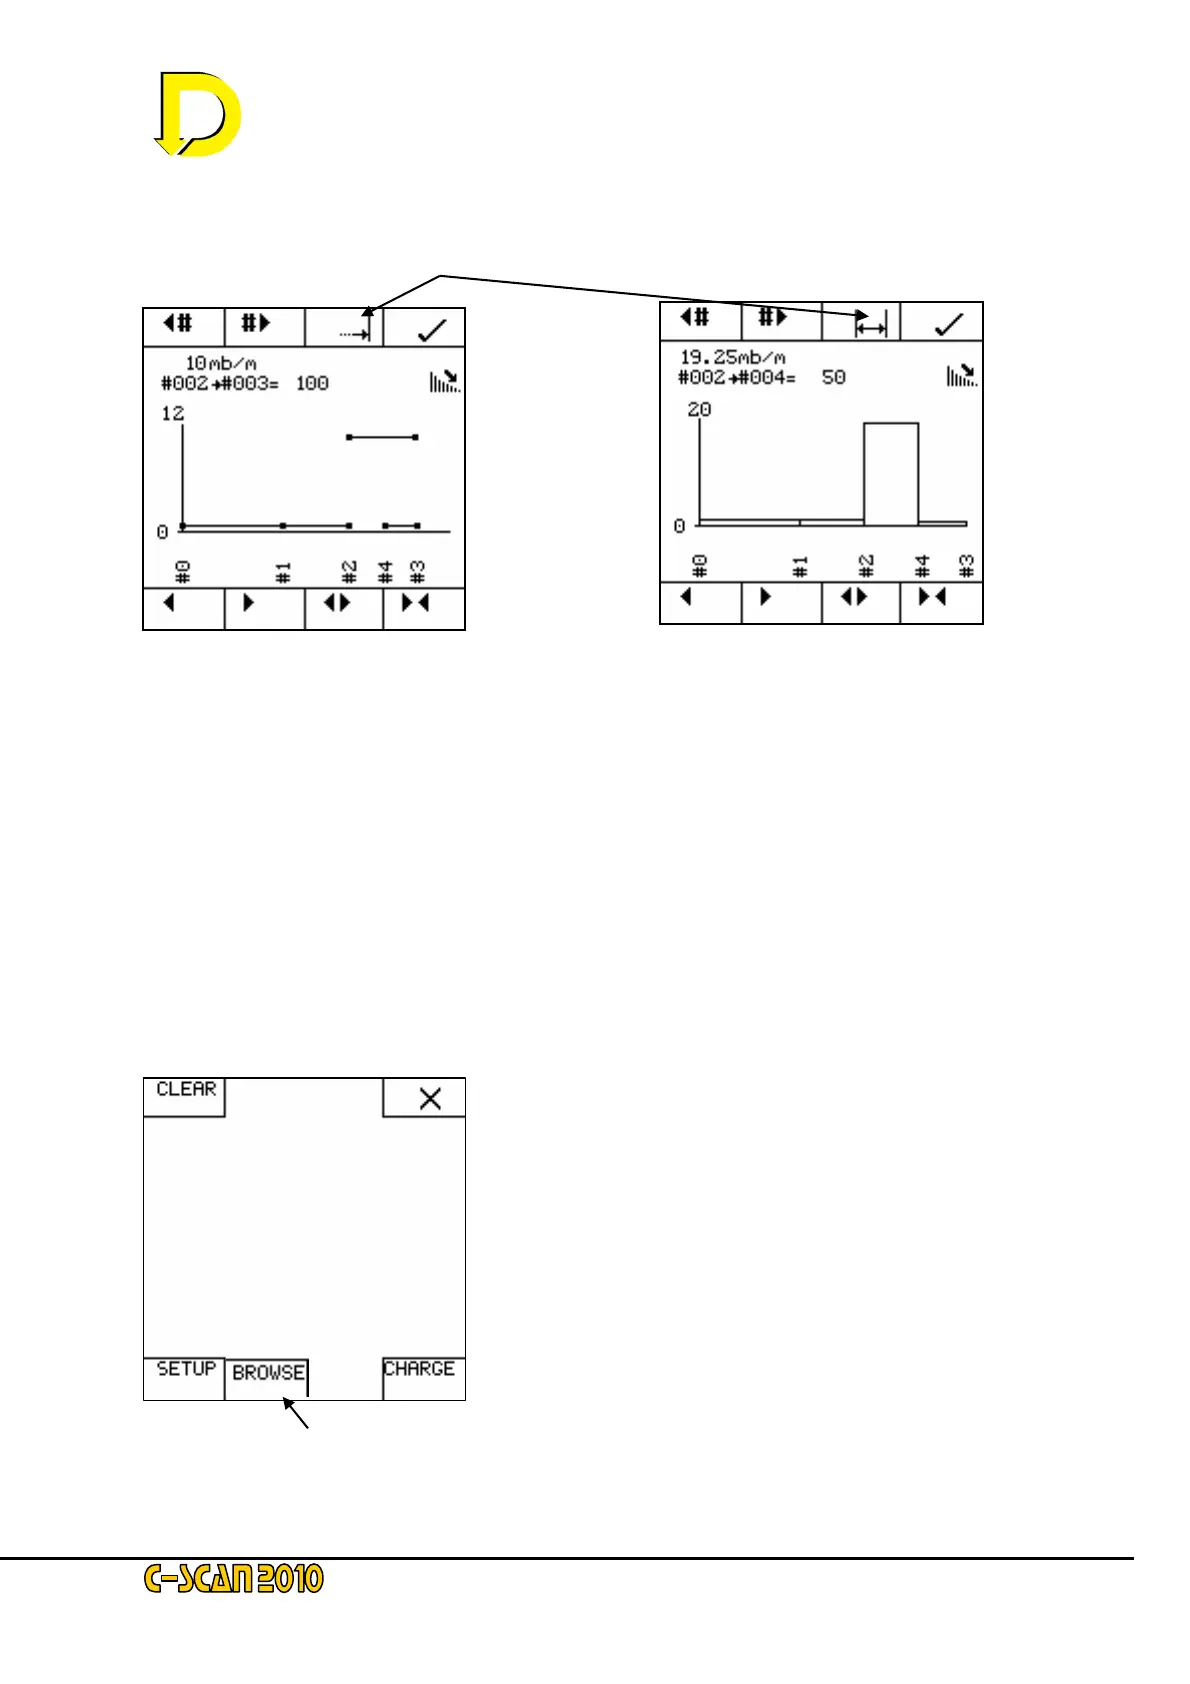
The graph on the left shows attenuation as the points were gathered (sequenced in time). The
graph on the right shows the points sequenced for chainage.
To switch between the two, press
Use the ‘◄# and #►’ arrow keys to choose a section of the survey. As we can see the
attenuation between #02 and #04 is 19.25 mB/m.
Clear the memory and run the demo again. This time do not use GPS and enter distances
manually using negative distances and see how the graphs change.
4.7. Notes on Graphs
It is inconvenient to have to store a point to view the graphs of a survey. There is another way,
however, using the BROWSE mode.
From the start screen press MENU. If a survey is in progress or a previous survey has been
started (i.e. there is data in the memory), the menu screen will display the BROWSE key:
NOTE: The BROWSE key only appears as available if the memory is not empty.
Press the BROWSE key and the following screen appears:
 Loading...

