Leaders in Pipeline Survey Systems
OPERATOR’S MANUAL
Issue 4.04 - 1207 17
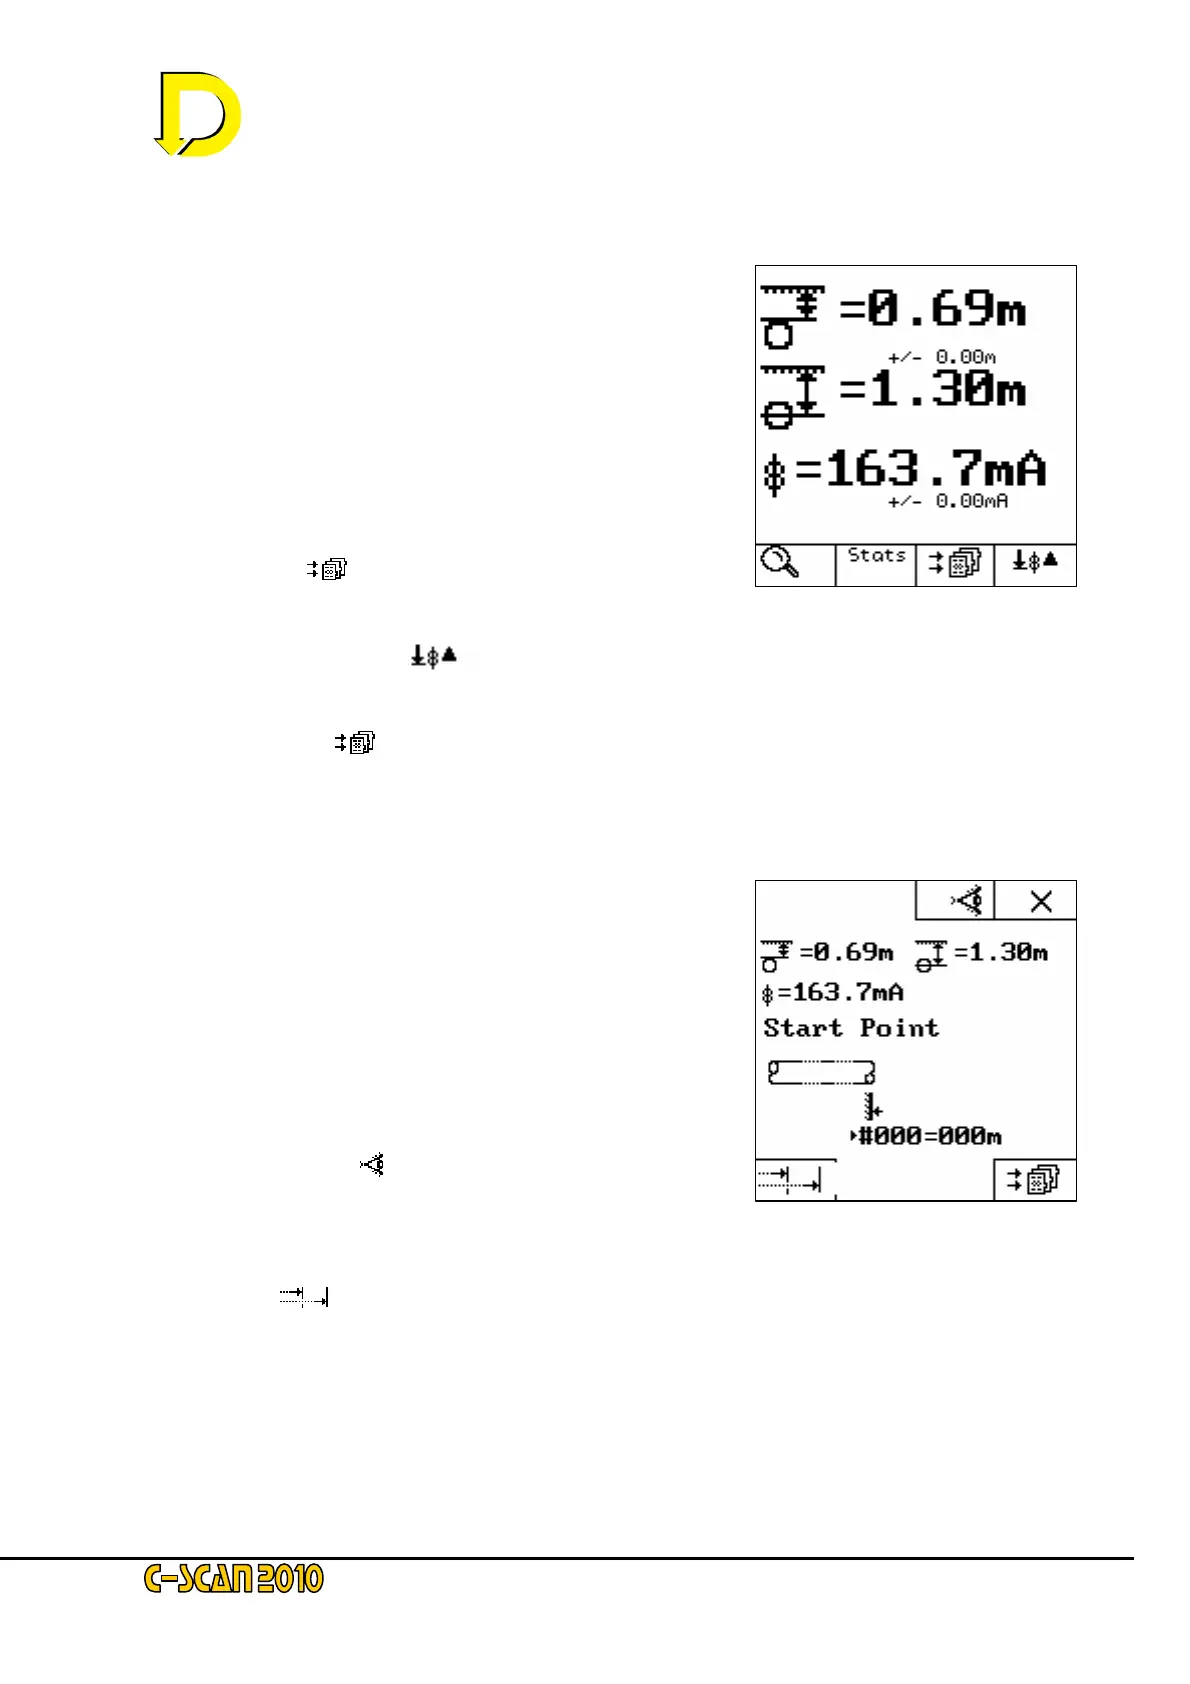
2.3.4. Calculate
After a small delay (indicated by the hour-glass symbol with
a count to 300) the screen will display the calculated figures
– see Fig. 16 right. Statistical analysis shows the error
function for depth and current (shown as +/- 0.00 in this
example).
Three newly available keys are now displayed:
• STATS – this gives the statistical breakdown
of the samples taken.
• STORE [ ]- this stores the data and continues to
the next screen – see Fig. 17 below
• RE-CALCULATE [ ]- this re-takes the
sample and re-calculates the data.
Press the STORE [
] key now.
2.3.5. Store Data
As this was the first point of the survey there
is no other point of reference with which to calculate
attenuation, conductance and resistance, so
this point is designated the START POINT.
NOTE: pressing
8
the key returns to the SEARCH mode,
and data stored by pressing the STORE key is removed.
Two newly available keys are now displayed:
VISIBLE FEATURE [
] – this enables
a graphic icon representing a landscape feature
to be noted and tagged on to the data. The icons
are self-evident – for a full list see page 11 above.
CHAINAGE [
] – this allows absolute distance to be entered – e.g. a pipeline
Distance marker – rather than referencing from zero (relative) – see Fig. 17 above.
NOTE: for this example only relative distances are used. Chainage is covered in Section 4.5 later in this
manual.
Fig. 16 – the Calculate screen
Fig. 17 – the Store Data screen
 Loading...

