Leaders in Pipeline Survey Systems
OPERATOR’S MANUAL
Issue 4.04 - 1207 20
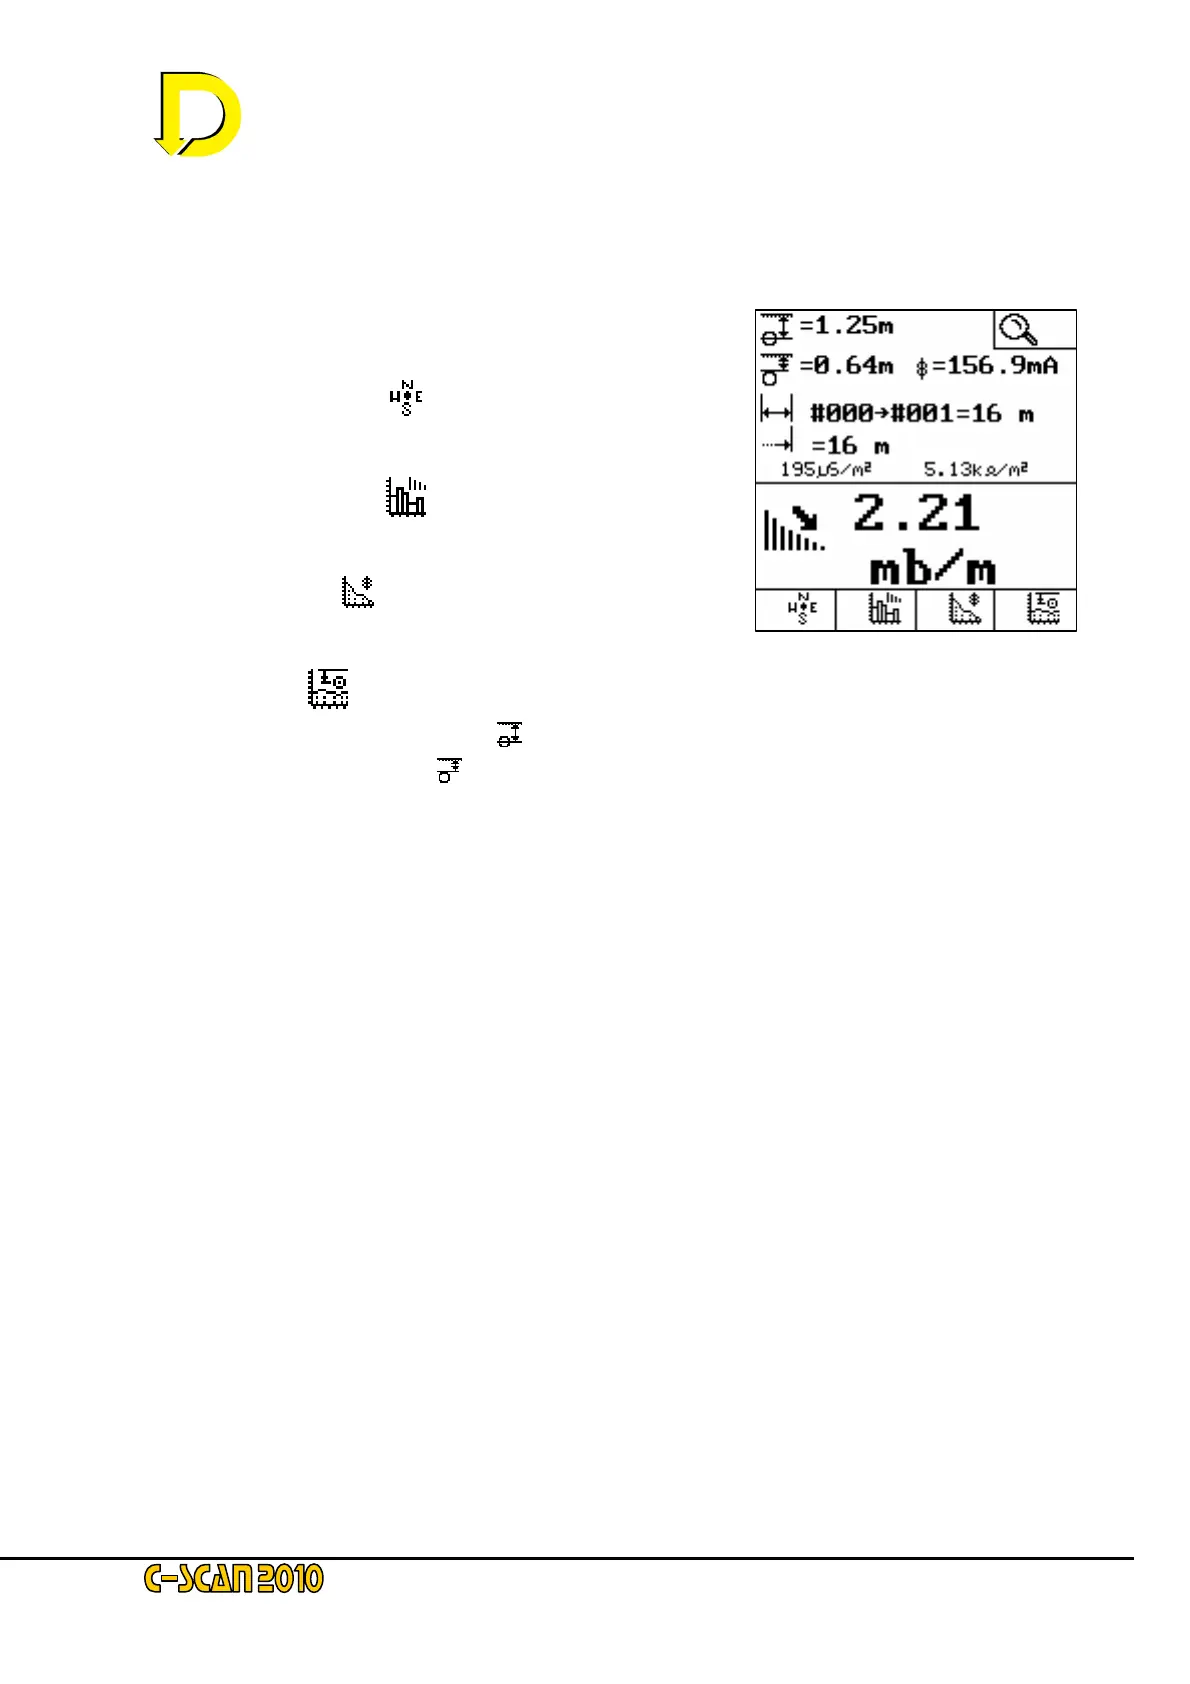
2.3.7. Graphs
The next screen allows graphs to be plotted on the screen to provide the operator with a quick
method of viewing the data so far acquired, without having to download to a computer.
The newly available keys are now:
GPS POSITION PLOT [
] – this shows a plan view of
the pipeline to scale.
ATTENUATION PLOT [
] – this shows a bar graph of
the attenuation on this section of the pipeline
CURRENT PLOT [
] – this shows the absolute current
over the surveyed sections
DEPTH PLOT [
]- this shows the depth to:
• the centre-line [
] of the pipeline
• or cover [
].
That is the procedure – now just practice by continuing with your survey.
Fig. 22 – the Graphs screen
 Loading...

