Prosonic S FDU90/91/91F/92/93/95/96
Endress + Hauser 5
Input
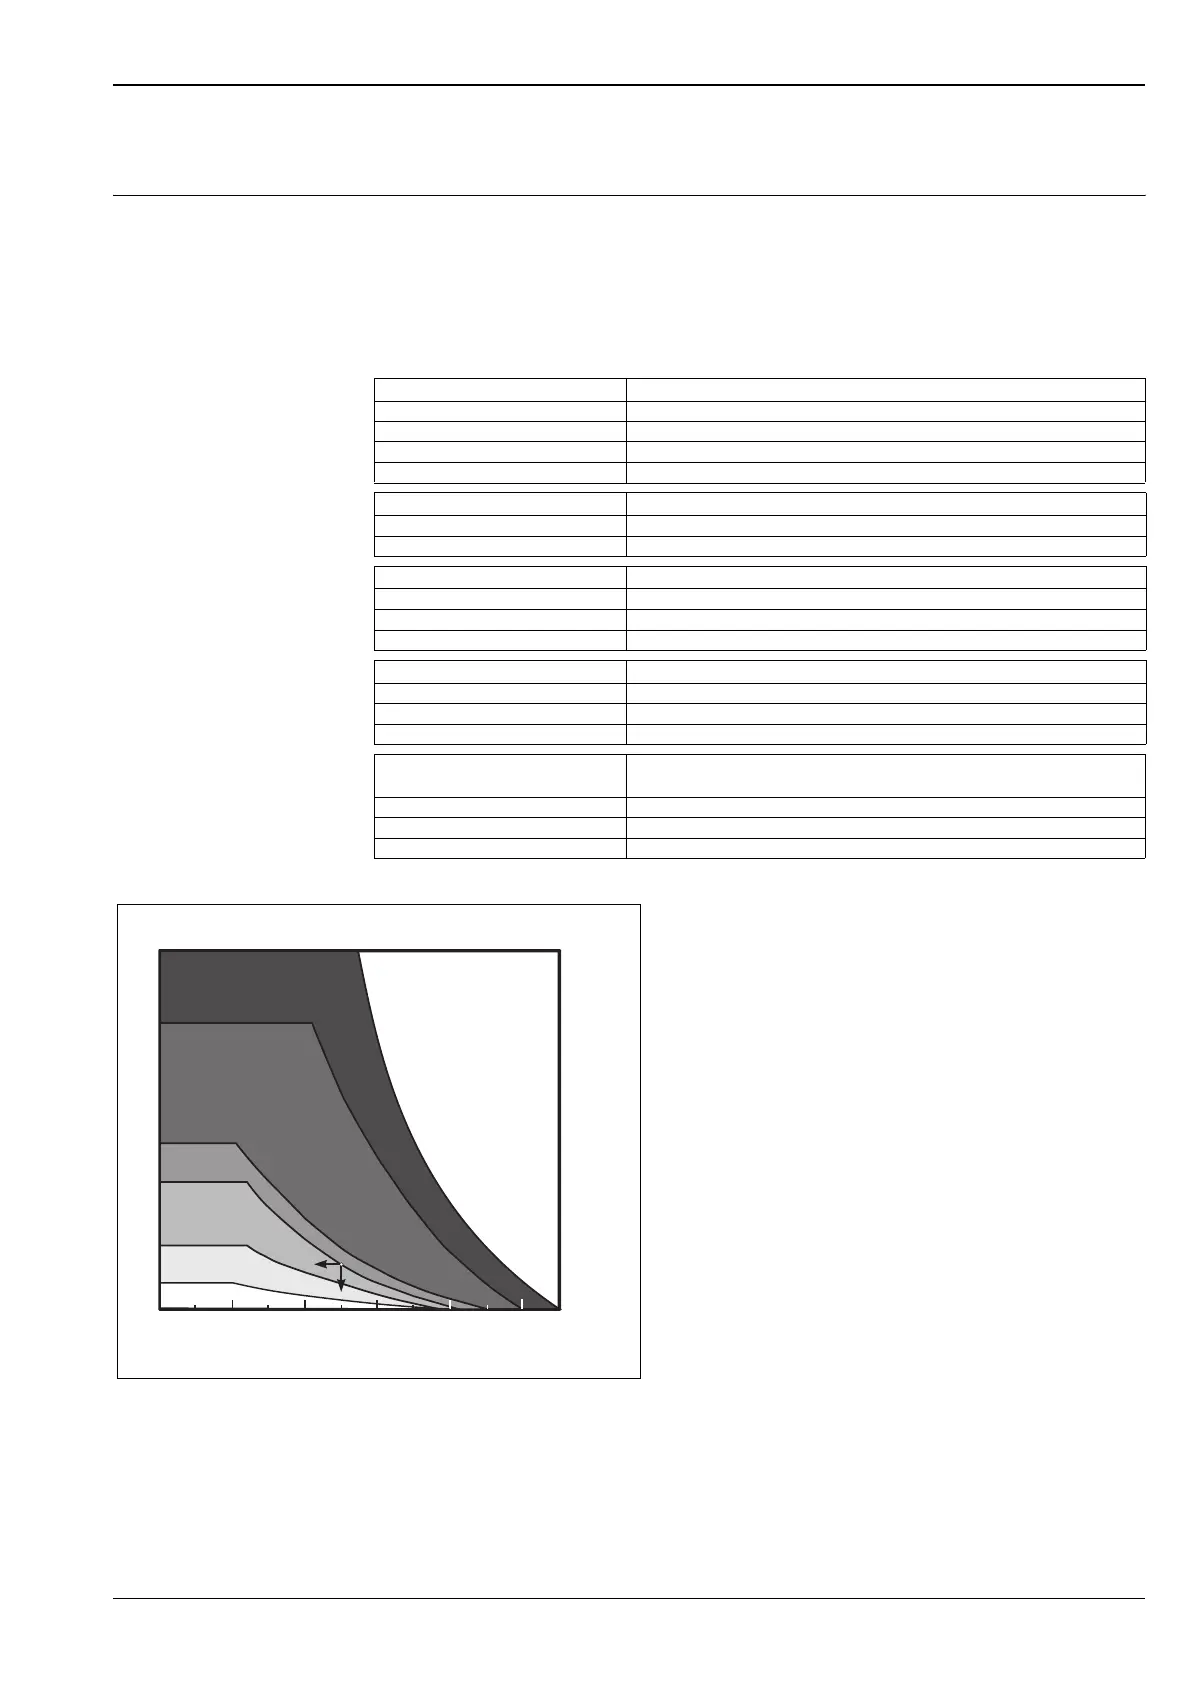
Measuring range The effective range of the sensors is dependent on the operating conditions. To estimate the range, proceed as
follows (see also the example):
1. Determine which of the influences shown in the following table are appropriate for your process.
2. Add the corresponding attenuation values.
3. From the total attenuation, use the diagram to calculate the range.
Fluid surface Attenuation
calm 0 dB
waves 5 ... 10 dB
strong turbulence (e.g. stirrers) 10 ... 20 dB
foaming ask Endress+Hauser
Bulk material surface Attenuation
hard, rough (e.g. rubble) 40 dB
soft (e.g. peat, dust-covered clinker) 40 ... 60 dB
Dust Attenuation
no dust formation 0 dB
little dust formation 5 dB
heavy dust formation 5 ... 20 dB
Filling curtain in detection range Attenuation
none 0 dB
small quantities 5 dB
large quantities 5 ... 20 dB
Temperature difference between
sensor and product surface
Attenuation
to 20 °C 0 dB
to 40 °C 5 ... 10 dB
to 80 °C 10 ... 20 dB
L00-FDU9xxxx-05-00-00-xx-001
A: Attenuation (dB); R: Range (m)
Example
• Silo with rubble: ~ 40dB
• small quantities of
filling curtain: ~ 5dB
• little dust: ~ 5dB
total: ~ 50dB
=> Range approx. 8 m
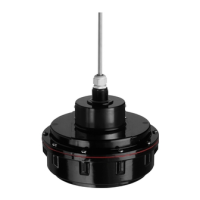
for FDU92
0204060 80 100
110
45
70
25
20
10
0
FDU 95
FDU 96
FDU 93
FDU 92
FDU 91(F)
A [dB]
R[m]
FDU90
3
 Loading...