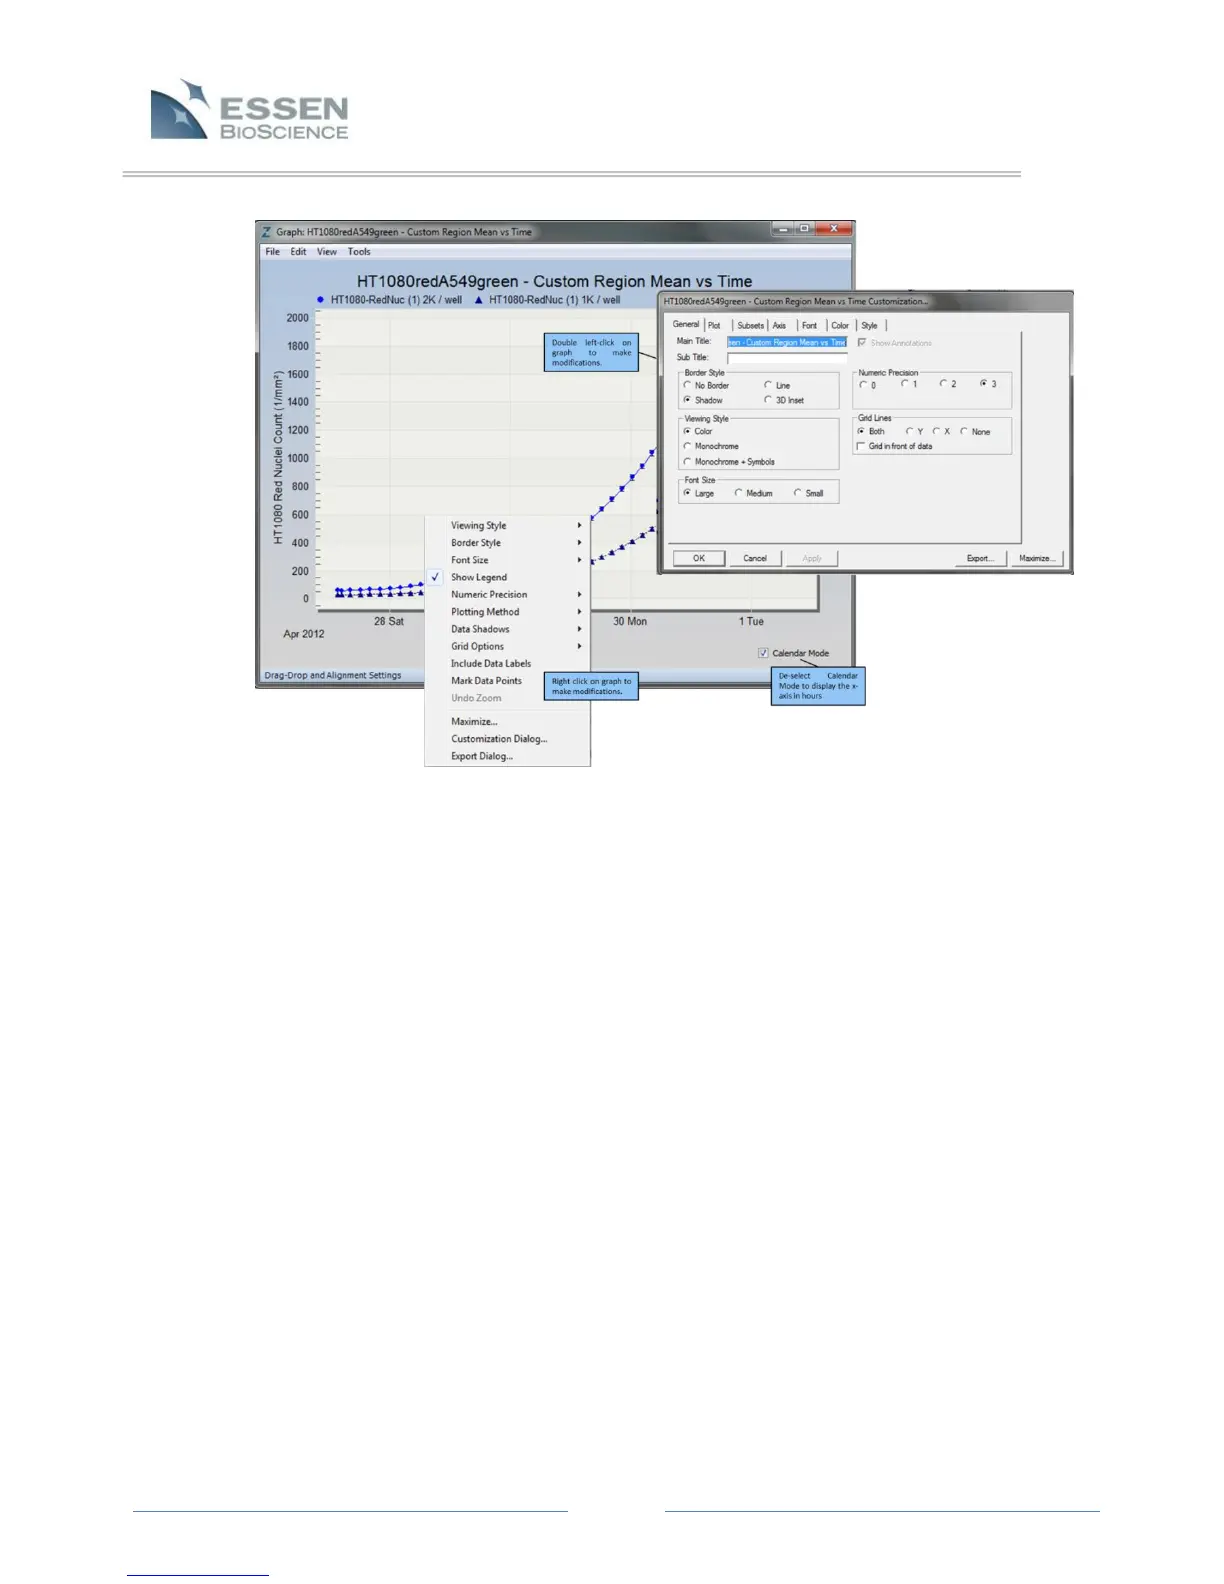
Look at the graph in Figure 19. Because Region: “Custom”, Group: “Replicates” was
selected, two traces appear that represent the mean of all replicates in the selected
wells. When multiple wells/traces appear on a single graph, each one is listed at the top
of the window. The wells/sectors will be assigned default titles indicating the vessel label
and the well (A1, A2, A3, etc.) unless a plate map was applied in the Properties of the
vessel. When a plate map is linked to a vessel, titles will be defined by well information
within the plate map.
7.6.1.1 Graph Metric Window
The Graph Metric Window aides Users in defining the metrics and output of
the generated data.
Time Plot: Select Metric
When plotting kinetic traces, select the radio button for “Time Plot”.
Depending upon the Analysis Job performed (Basic Analyzer, Angiogenesis,
Scratch Wound, or NeuroTrack™) different metrics will be available for
graphing and exporting.
NOTE: Focus Position, Phase Exposure Time, Uncorrected Red Image Mean,
and Uncorrected Green Image Mean are diagnostic tools used to confirm
Figure 19. Graph Window displaying Customization Features