18
GENERAL SPECIFICATIONS
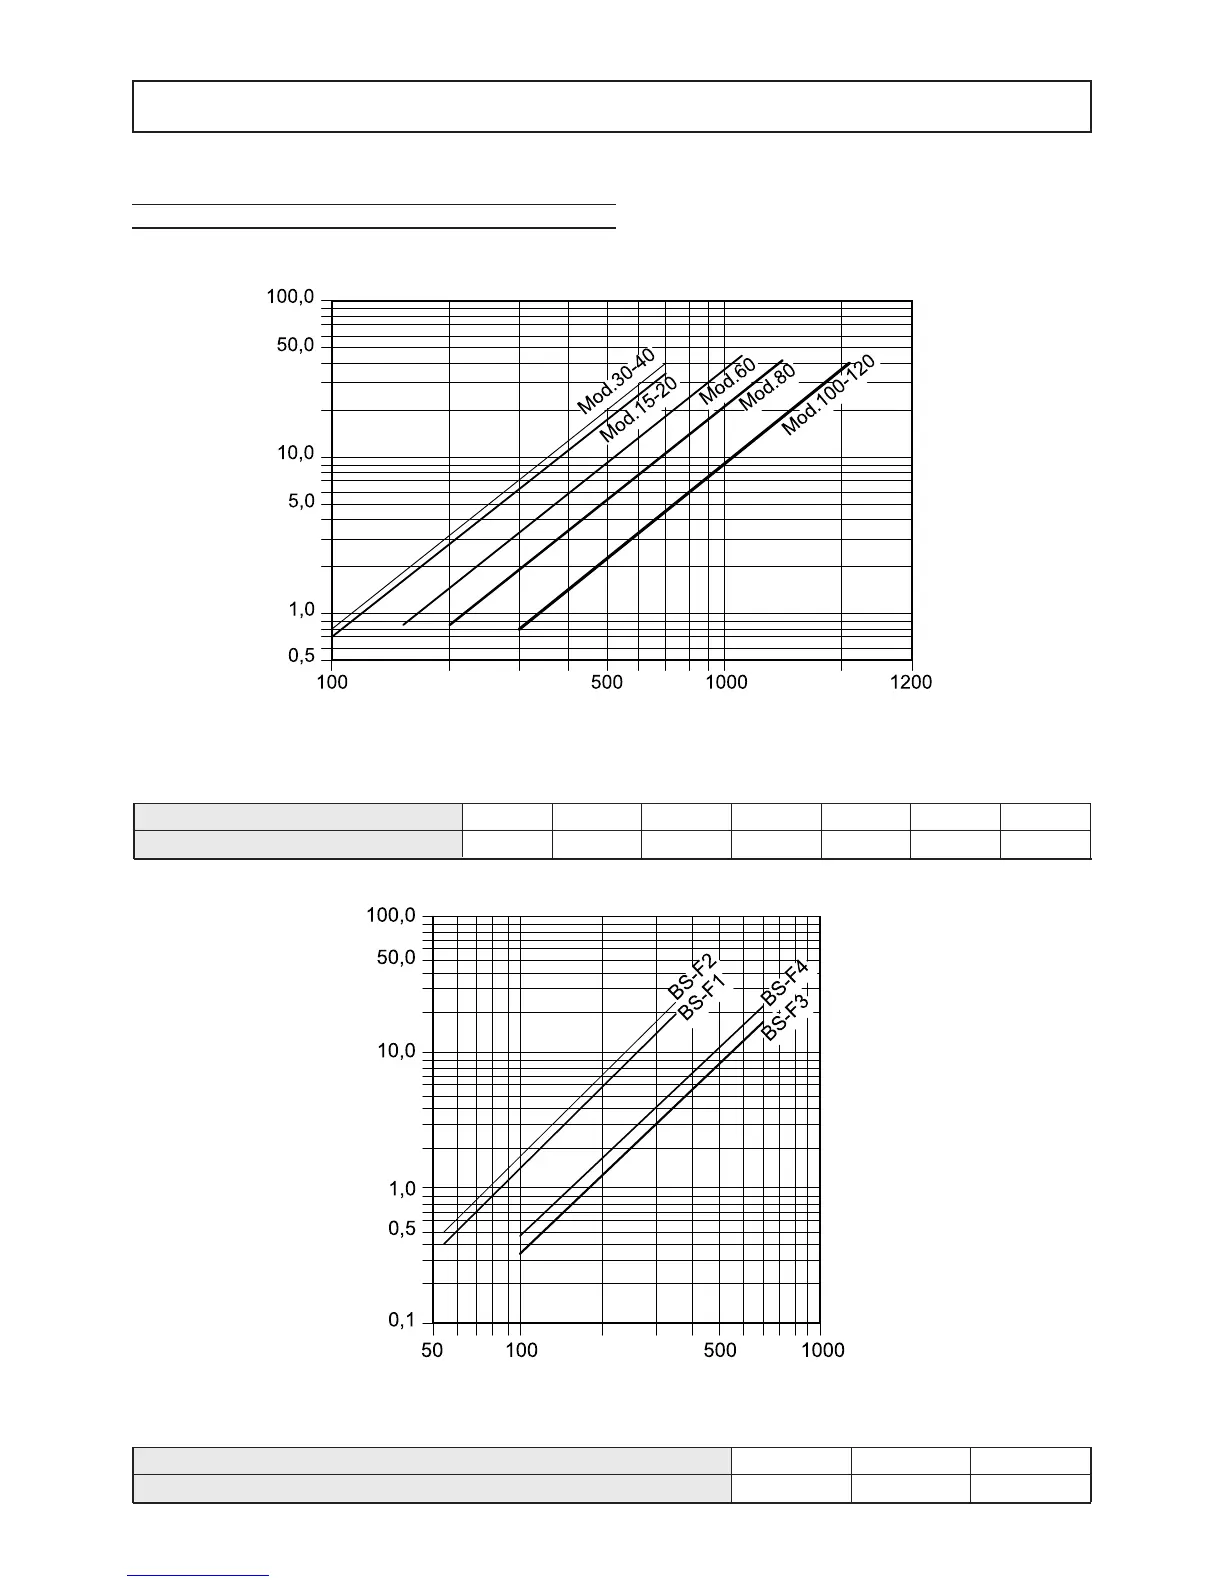
LOAD LOSSES ON WET SIDE
The following graph gives the load losses measured on the triple rank bank installed in the fancoil unit.
The load losses shown in the previous figure concern an average water temperature of 10°C. The table below gives
the loss correction factors measured as the average temperature varies.
Graph 5 gives the load loss values measured in the single-rank bank envisaged as optional on the fancoil unit:
Graph 4
Graph 5
Average H
2
O temperature
5101520506070
Corrective coefficient
1.05 1.0 0.97 0.95 0.8 0.75 0.71
Average H
2
O temperature
50 60 70
Corrective coefficient
1.10 1.05 1.0
The load losses shown in the previous figure concern an average water temperature of 70°C. The table below gives
the loss correction factors measured aa the average temperature varies.
Water flow rate [l/h]
Load losses [kPa]
Water flow rate [l/h]
Load losses [kPa]
Tab.7
Tab.8
 Loading...