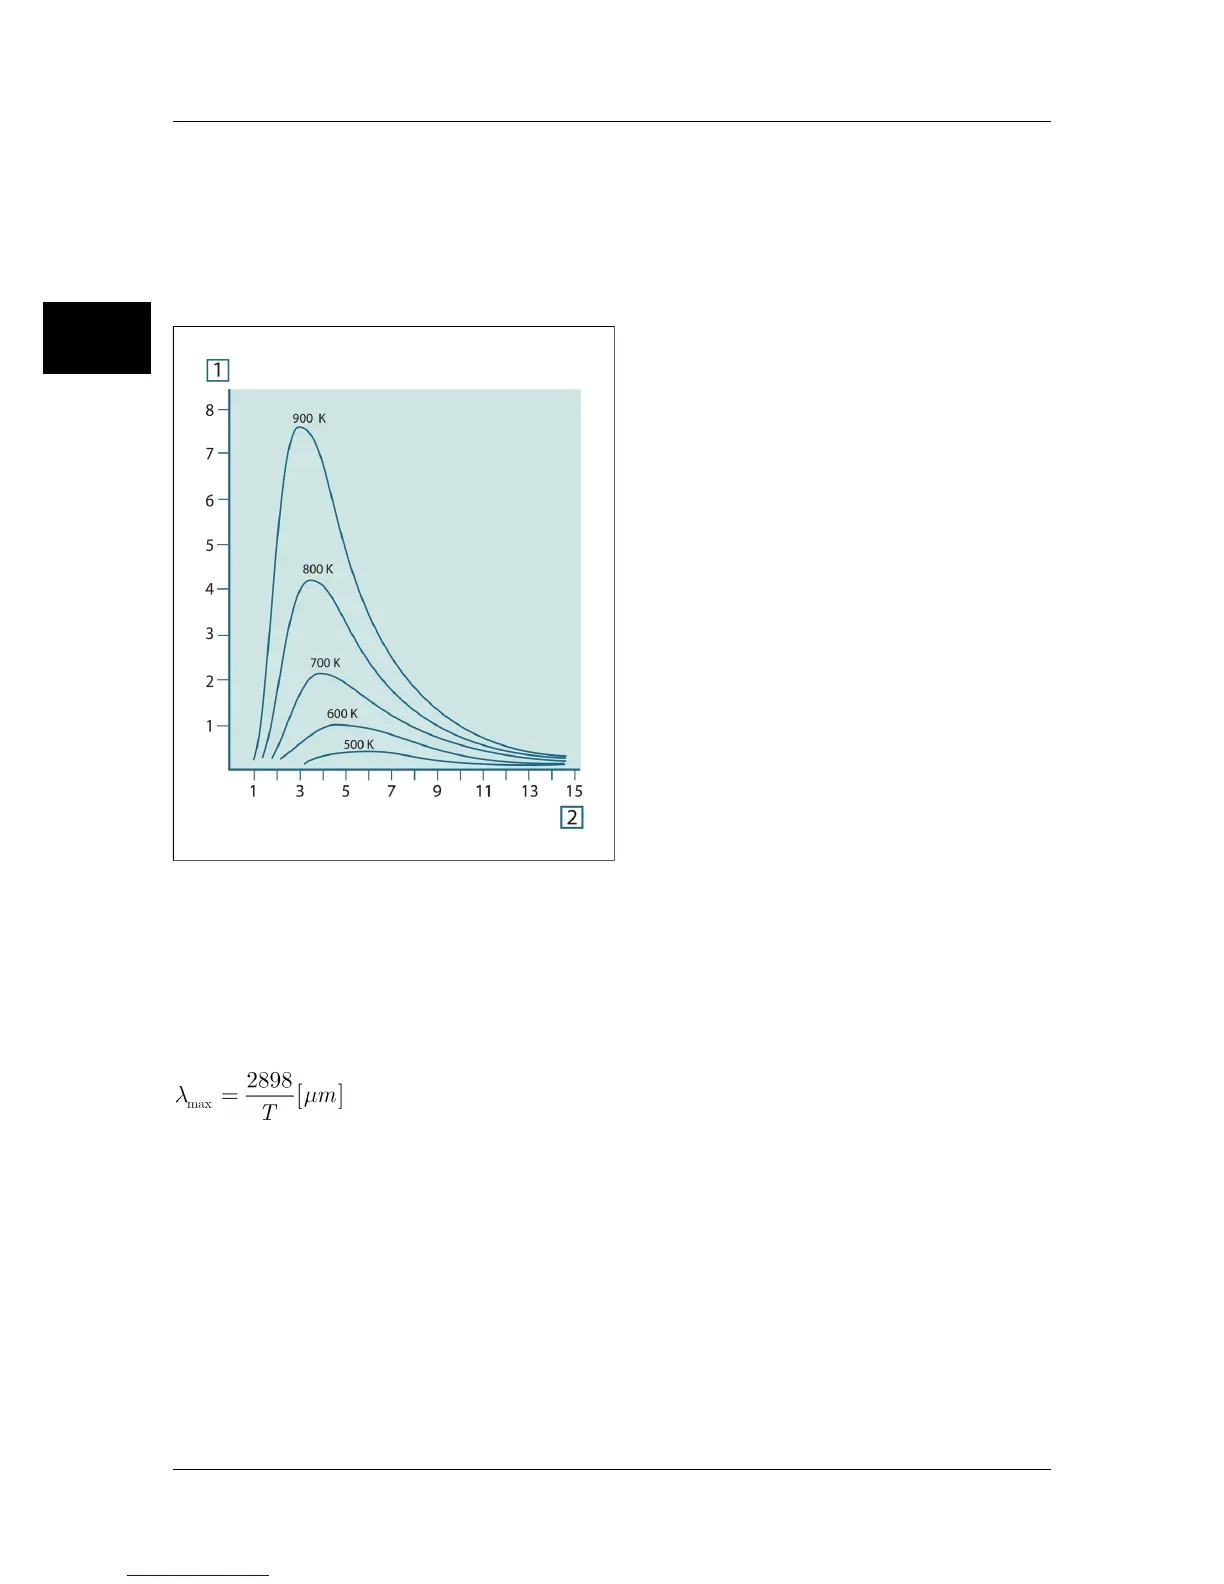
Planck’s formula, when plotted graphically for various temperatures, produces a
family of curves. Following any particular Planck curve, the spectral emittance is zero
at λ = 0, then increases rapidly to a maximum at a wavelength λ
max
and after passing
it approaches zero again at very long wavelengths. The higher the temperature, the
shorter the wavelength at which maximum occurs.
10327103;a3
Figure 18.4 Blackbody spectral radiant emittance according to Planck’s law, plotted for various absolute
temperatures. 1: Spectral radiant emittance (W/cm
2
× 10
3
(μm)); 2: Wavelength (μm)
18.3.2 Wien’s displacement law
By differentiating Planck’s formula with respect to λ, and finding the maximum, we
have:
This is Wien’s formula (after Wilhelm Wien, 1864–1928), which expresses mathemati-
cally the common observation that colors vary from red to orange or yellow as the
temperature of a thermal radiator increases. The wavelength of the color is the same
as the wavelength calculated for λ
max
. A good approximation of the value of λ
max
for
a given blackbody temperature is obtained by applying the rule-of-thumb 3 000/T
μm. Thus, a very hot star such as Sirius (11 000 K), emitting bluish-white light, radiates
with the peak of spectral radiant emittance occurring within the invisible ultraviolet
spectrum, at wavelength 0.27 μm.
18
116 Publ. No. 1558439 Rev. a156 – ENGLISH (EN) – February 28, 2006
18 – Theory of thermography
 Loading...