Introducing the Fluke 43B
Main Menu
1
13
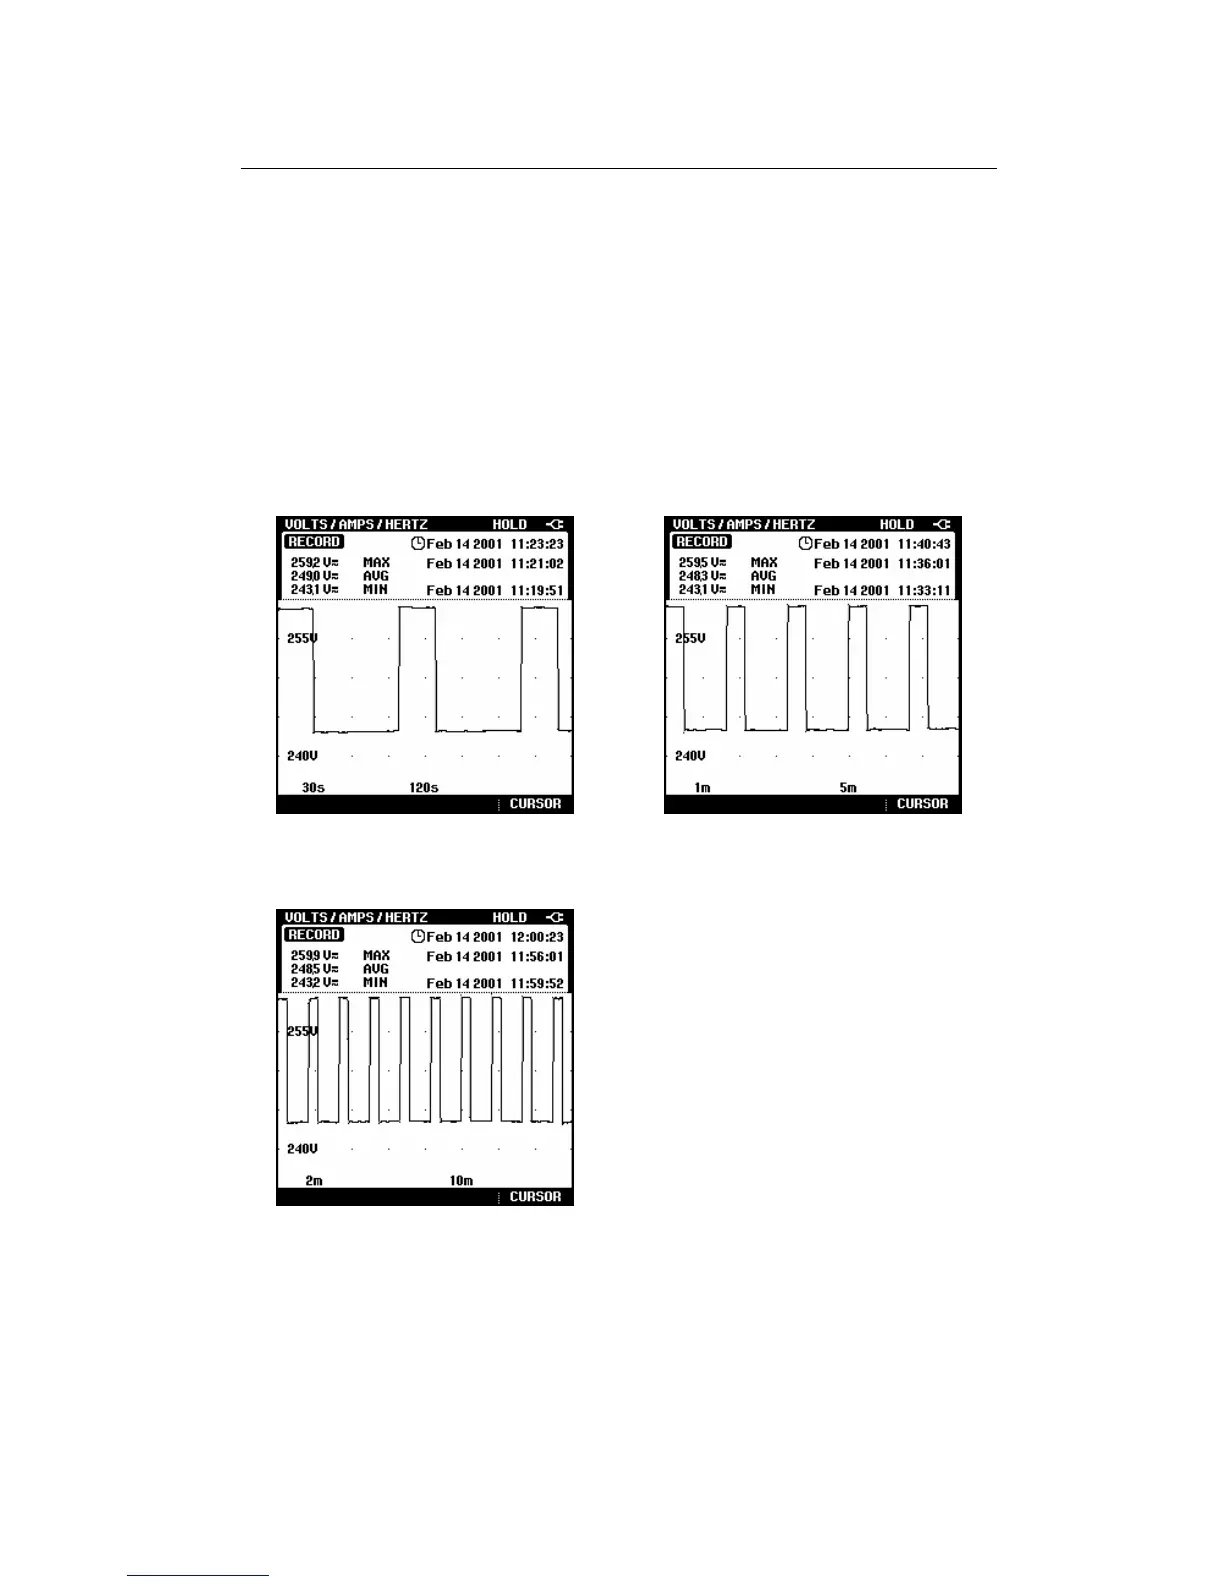
In both Sags & Swells and Record mode the recording time can be set to
‘Endless’. This refers to the compression method that is used to generate the
plot. With the recording time set to Endless, the plot will start with the 4-minute
time scale, and compresses each time the plot runs off the screen. At the end
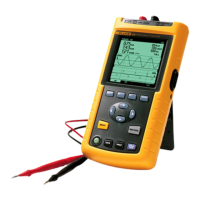
of 4-minutes, the plot will compress to half-screen and the time scale changes
to 8 minutes. Fluke 43B does this by looking at every pair of min/max values
and keeping only the highest/lowest values. The average values are
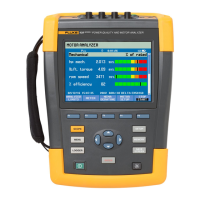
recalculated. The screen will start with 4 minutes and go to 8 minutes, then 16
minutes, and so on up to 16 days, always keeping the worst-case or extreme
values of each plot interval. If you do not know how long you are going to
monitor, this will guarantee the best resolution. The process stops after 16
days. The figures below show this process.
Screen with 4 minutes time scale Screen with 8 minutes time scale
Screen with 16 minutes time scale