Agreement with GM Glucose Levels
The accuracy of GM versus YSI reference was also assessed by calculating the percentage of System
readings that were within 15%, 20%, 30% and 40% for reference values 80 mg/dL and above, and
15 mg/dL, 20 mg/dL, 30 mg/dL and 40 mg/dL for values below 80 mg/dL when glucose levels are
assigned using the GM readings. The results are presented in Table 2. Overall 83.6% of results were
within ±20 mg/dL / 20% of the YSI reference.
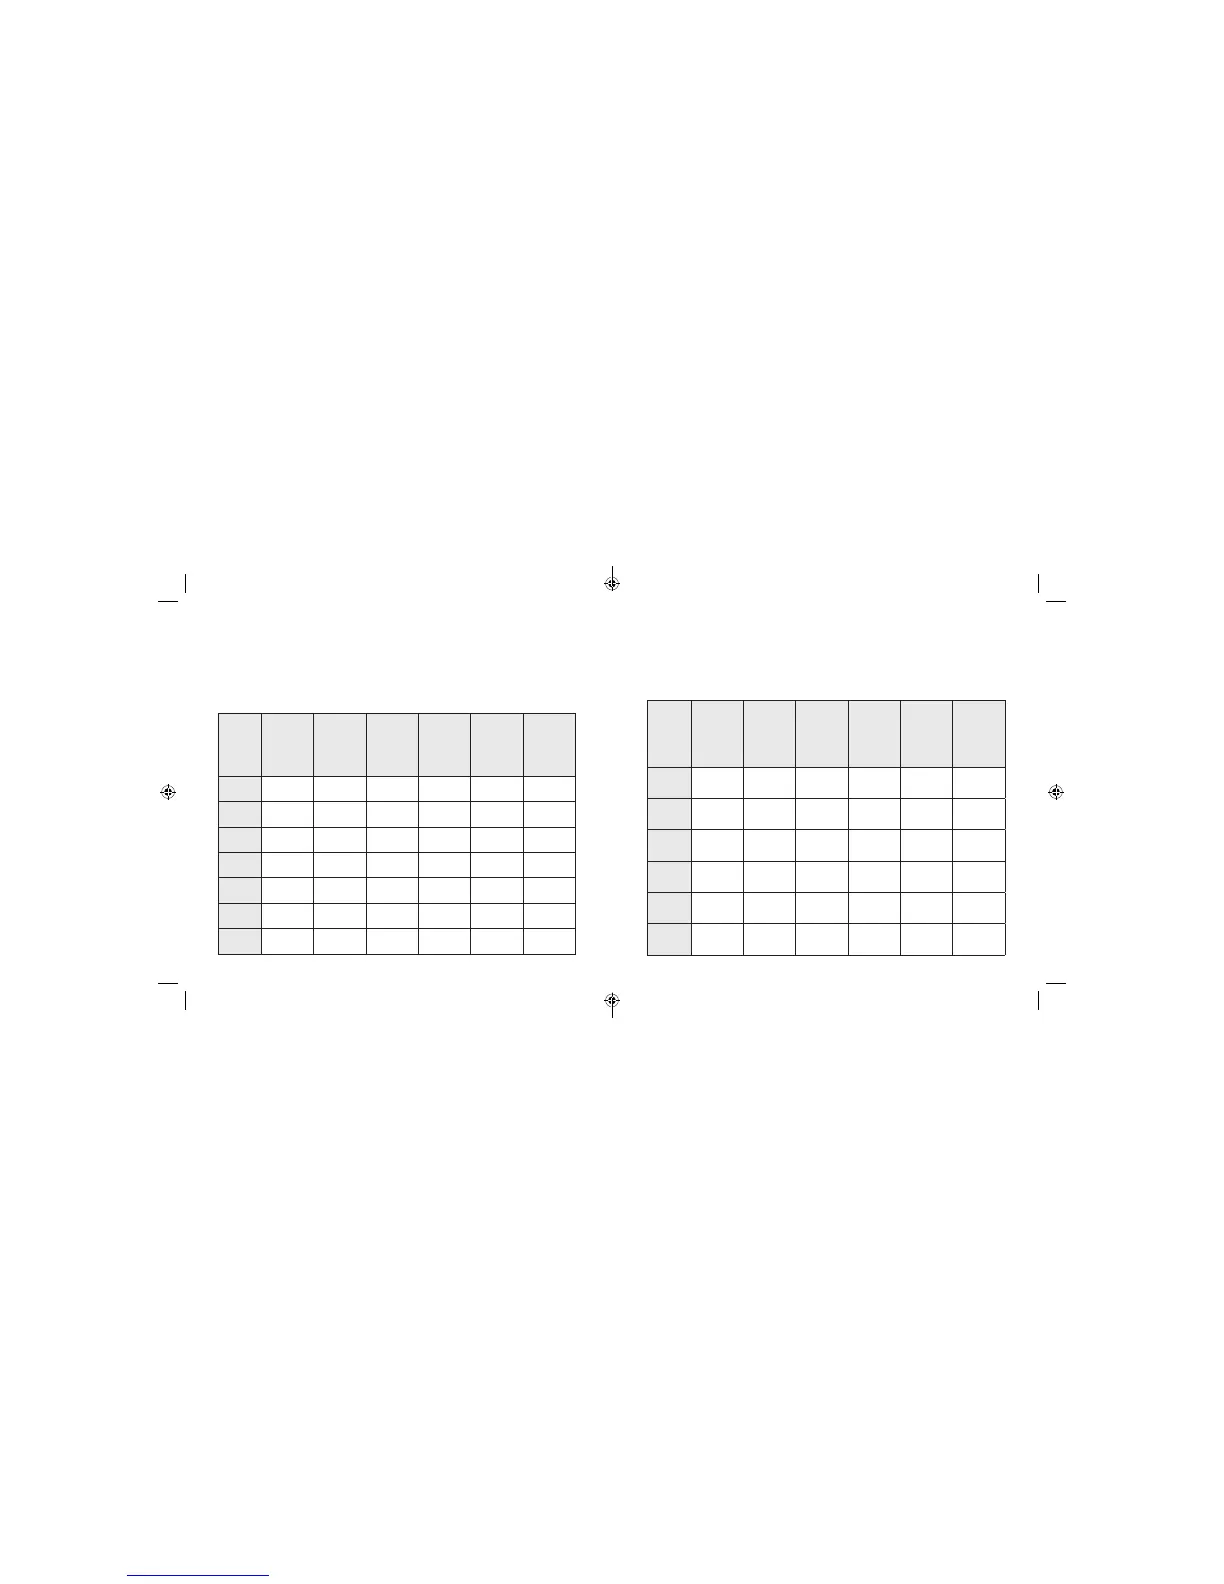
Table 2: Number and Percent of Results within YSI Reference
GM
Glucose
Level
(mg/dL)
Number
of GM-
Reference
Pairs
Within
±15% /
±15 mg/dL
Within
±20% /
±20 mg/dL
Within
±30% /
±30 mg/dL
Within
±40% /
±40 mg/dL
Outside
±40% /
±40 mg/dL
Overall 12323 71.7 83.6 94.9 98.2 1.8
40-50 28 17.9 28.6 50.0 71.4 28.6
51-80 586 54.1 70.6 88.2 94.2 5.8
81-180 6685 72.2 83.0 94.2 97.9 2.1
181-300 4449 73.9 86.2 96.9 99.2 0.8
301-400 541 70.1 86.7 97.2 98.9 1.1
401-500 34 55.9 88.2 97.1 100.0 0.0
Agreement on Day 1 against YSI Reference
The accuracy of GM versus YSI reference on the rst day of sensor wear was assessed by calculating
the percentage of System readings that were within 15%, 20%, 30% and 40% for reference values
80 mg/dL and above, and 15 mg/dL, 20 mg/dL, 30 mg/dL and 40 mg/dL for values below 80 mg/dL
by hourly intervals. The results are presented in Table 3.
Table 3: Number and Percent of Results within YSI Reference
Time
Interval
(hour)
Number
of GM-
Reference
Pairs
Within
±15% /
±15 mg/dL
Within
±20% /
±20 mg/dL
Within
±30% /
±30 mg/dL
Within
±40% /
±40 mg/dL
Outside
±40% /
±40 mg/dL
(0-2) 235 60.9 73.2 92.8 98.3 1.7
(2-4) 552 67.4 77.7 90.4 96.4 3.6
(4-6] 557 61.4 74.3 89.2 95.9 4.1
(6-8] 534 65.5 80.5 94.0 98.3 1.7
(8-12] 239 66.1 83.3 97.9 99.2 0.8
(12-24] 436 59.9 77.1 93.6 97.7 2.3
46 47
ART26944_rev-C_manual.indd 46-47 9/23/16 9:19 AM