Do you have a question about the Garmin GPSMAP 4212 and is the answer not in the manual?
Provides quick access methods to navigate the chartplotter interface and its features.
Explains how instructions are presented in the manual, including the use of soft keys and arrow indicators.
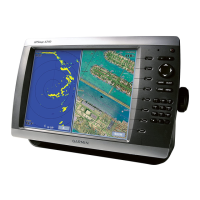
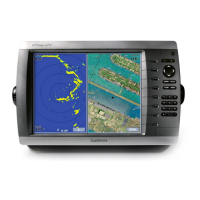
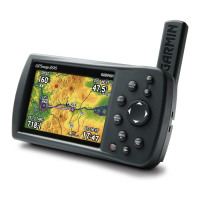
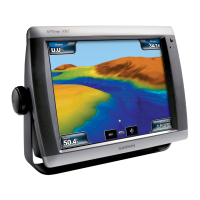
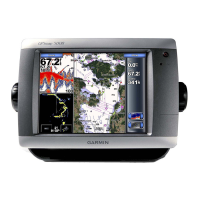
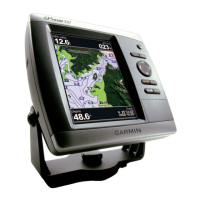
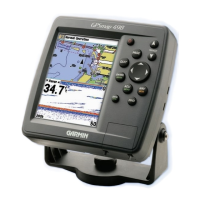
Introduces the physical layout and key components of the GPSMAP 4000 series chartplotter.
Details the procedure for powering on the chartplotter and navigating to the Home screen.
Explains how to properly shut down the chartplotter.
Guides users through the initial setup process for essential device configurations.
Describes how the chartplotter obtains satellite data to determine its current location.
Explains how to control screen brightness for optimal viewing in various lighting conditions.
Allows users to select display color schemes for day or night use.
Provides instructions for using SD cards for data storage and map updates.
Details the process of resetting the chartplotter to its original factory default configuration.
Shows how to access software versions, unit IDs, and other system details.
Explains how to use the simulator for practice without active GPS signals.
Describes the main menu and available options accessible from the Home screen.
Displays standard navigation data like buoys, lights, and depth soundings in an overhead view.
Offers a 3D view from above and behind the boat for enhanced visual navigation.
Provides a detailed 3D view from above and behind the boat for visual navigation aid.
Enhances bottom contours and depth for detailed fishing information, removing navigational data.
Presents an underwater 3D view of the sea floor based on chart data.
Explains how to use the navigation chart for course planning and map information.
Details how to adjust the map's zoom level using the range keys.
Allows customization of chart display options like waypoints, tracks, and chart details.
Explains the graphic symbols and features used on BlueChart g2 and g2 Vision charts.
Guides users on how to select a point on the chart and initiate navigation to it.
Describes how to scroll across the navigation chart to view different areas.
Explains how to select map features and access contextual information or actions.
Shows how to use the map pointer to retrieve detailed information about on-screen map items.
Displays tide level data and allows viewing of tide graphs for specific stations.
Covers options to customize chart appearance like photos, tides, service points, and roses.
Allows users to show or hide various data displays such as speed, heading, and fuel information.
Explains the conditions under which Wind VMG and Waypoint VMG are shown in the data bars.
Customizes visual aspects of the chart, including orientation, detail, heading lines, and map display types.
Provides a 3D view from above and behind the boat for visual navigation assistance.
Offers options to adjust settings for the Perspective 3D view, including tracks and other vessels.
Displays radar returns from the water surface when connected to a marine radar.
Allows overlaying radar information onto the Navigation chart.
Explains how to record, save, and manage the boat's path as tracks.
Details the process for saving the currently recorded track log.
Explains how to erase the active track log from the system.
Guides users on how to follow a recorded active track on the screen.
Provides instructions for modifying or removing previously saved track logs.
Covers settings for record mode, interval, and track color for active track logging.
Introduces the features offered by optional BlueChart g2 Vision SD cards for enhanced charting.
Explains how to insert and remove BlueChart g2 Vision SD cards for advanced mapping features.
Offers a detailed 3D view from above and behind the boat for navigation, using BlueChart g2 Vision.
Allows customization of Mariner's Eye 3D display, including style and chart appearance.
Enables or disables color coding for shallow water hazards on the chart display.
Provides an underwater view of the sea floor using depth contour data from BlueChart g2 Vision.
Covers options for the Fish Eye 3D view, such as view angle, sonar cone, and data bars.
Utilizes fishing charts for detailed bottom contours and depth soundings, ideal for offshore fishing.
Allows overlaying satellite images on the navigation chart for a realistic view.
Displays aerial photographs of landmarks, marinas, and harbors for orientation.
Shows details about current stations, including direction and speed, with graphical representations.
Includes detailed coastal roads and points of interest like restaurants and attractions.
Automatically creates passage plans and suggests routes based on chart information.
Explains how to choose pre-defined screen layouts for viewing multiple data types simultaneously.
Describes how to switch focus between screens and change the function of individual screen panes.
Details how to select which pane on the combinations screen is active.
Guides users on how to reassign data displays to different screen panes.
Explains how to expand a selected screen pane to fill the entire display.
Allows customization of screen combinations, including layout, functions, and data bar visibility.
Guides users on searching for and navigating to various points of interest, waypoints, and services.
Explains the procedure for discontinuing an active navigation route.
Details how to find destinations by typing their names using the chartplotter interface.
Covers storing, editing, and managing saved locations as waypoints.
Describes how to quickly mark a Man Overboard position and initiate a return course.
Provides instructions for modifying the name, symbol, or other attributes of a saved waypoint.
Explains how to relocate a waypoint on the chart or by entering coordinates.
Shows how to access and review all saved waypoints.
Guides users on removing waypoints or Man Overboard markers from the system.
Covers the process of creating, storing, and managing navigation routes.
Explains how to generate a route automatically using chart data and guidance features.
Details how to modify existing routes, including turning points and names.
Provides instructions for removing saved routes from the system.
Explains how to skip a specific waypoint while navigating a route.
Describes how to engage the autopilot when initiating navigation sequences.
Displays tide level data and allows viewing of tide graphs for specific stations.
Provides details on current stations, showing direction, speed, and graphical representations.
Shows sunrise, sunset, moonrise, moonset, and moon phase data.
Accesses saved waypoints, routes, and tracks, and manages data transfers.
Guides users on transferring map data from MapSource to the chartplotter via SD card.
Explains data sharing between chartplotters on a Garmin Marine Network.
Details how to save chartplotter data to a computer using an SD card.
Guides users on loading previously backed-up data onto the chartplotter.
Provides a method to clear all user-created data like waypoints, routes, and tracks.
Displays logs of DSC calls and contacts, aiding in communication management.
Shows real-time engine performance data like RPM, temperature, and oil pressure.
Displays fuel levels, flow rates, economy, and range based on connected fuel sensors.
Allows display of video input from connected cameras or other video sources.
Sets up core device functions like simulator mode, auto power, beepers, and GPS status.
Allows selection of the user interface language for the chartplotter.
Customizes navigation settings such as route labels, turn transitions, and speed sources.
Configures parameters for automatic route calculation, including safe depth and height.
Sets global and individual units for depth, temperature, distance, speed, and more.
Configures time format, time zone, and daylight saving time settings.
Manages NMEA 0183, NMEA 2000, and wireless device settings for data connectivity.
Enables and configures various audible alarms for navigation, system, and sonar events.
Configures alarms for anchor drag, arrival, and off-course conditions.
Sets up alarms related to the system clock, battery status, and GPS accuracy.
Configures sonar-related alarms for shallow and deep water conditions.
Sets an alarm for water temperature deviations from a specified range.
Configures sonar alarms to detect suspended targets based on fish size symbols.
Enables alarms for weather events like tornadoes, severe storms, and floods.
Configures an alarm to notify when the onboard fuel level reaches a critical point.
Sets up boat-specific parameters like keel offset, temperature offset, and fuel capacity.
Calibrates depth readings by accounting for the keel's position relative to the transducer.
Manages the display and configuration of AIS and DSC information for other boats.
Sets up collision alarm parameters, including range and time-to-intersection for detected targets.
Sets up and controls XM satellite radio audio features, including channel selection and presets.
Lists and provides details on devices connected to the Garmin Marine Network.
Allows users to label connected network devices for easier identification.
Provides steps to power on and activate the marine radar system.
Explains how to safely shut down the radar system and return it to standby mode.
Describes the standard radar operation mode for viewing radar information.
Explains Sentry mode for timed radar transmissions and guard zones with alarms.
Configures the radar antenna for intermittent transmit and standby cycles.
Allows adjustment of the duration for radar transmit and standby periods.
Activates a radar guard zone to alert when objects enter a defined safety area.
Details how to define the shape and size of the radar guard zone.
Explains how to select targets on the radar screen for identification and measurement.
Describes how to display radar information superimposed on the navigation chart.
Guides users on activating the radar overlay feature.
Points to where further radar overlay settings can be found.
Adjusts gain and noise rejection settings for the best radar image quality.
Explains how to filter out clutter caused by rain, sea conditions, or cross-talk.
Covers using the Variable Range Marker and Electronic Bearing Line to measure distance and bearing.
Controls the display of AIS and MARPA targets on the radar screen.
Adjusts advanced radar settings like rotation speed, front of boat offset, and display appearance.
Displays a full-screen graph of the transducer's sonar readings.
Shows full sonar data alongside a zoomed-in portion for detailed analysis.
Displays both 50kHz and 200kHz transducer frequencies simultaneously.
Keeps a graphic log of water temperature readings over time from a temperature-capable transducer.
Configures universal sonar settings like scroll speed, surface noise, and depth line.
Customizes how sonar data is displayed, including fish symbols, whiteline, and color schemes.
Adjusts advanced sonar parameters like gain, zoom levels, and range.
Details features available when connecting the chartplotter to a VHF radio via NMEA networks.
Explains how to add vessel contacts to the DSC list for making calls.
Displays logs of DSC calls and contacts, aiding in communication management.
Alerts users to incoming distress calls from the VHF radio and records associated data.
Describes how radio-initiated MOB calls trigger chartplotter navigation prompts.
Explains how chartplotter-activated MOB calls prompt the radio to send a distress call.
Allows tracking vessels that send position reports via VHF radio.
Sets up display options for vessel trails, showing reported positions and paths.
Adjusts how long trail points for tracked vessels remain visible on the chart.
Disables the display of trail lines for all tracked vessels.
Controls the visibility of trail lines for individual vessels on the navigation chart.
Allows customization of the appearance of vessel trail lines.
Guides users on initiating routine calls to other vessels via the VHF radio interface.
Explains how to make routine calls to AIS targets directly from the chartplotter.
Introduces the XM services for weather information and audio playback on the chartplotter.
Details how XM WX Weather data is received and displayed on the chartplotter.
Displays NEXRAD radar data showing precipitation, storm cells, and lightning.
Activates an animated loop of NEXRAD precipitation data.
Controls the display of cloud cover information on the precipitation screen.
Explains how storm cells and their projected paths are displayed.
Describes how lightning strike icons are represented on the weather display.
Details hurricane, tropical storm, and depression tracking, including projected paths.
Shows marine warning areas highlighted on the chart and explains how to view details.
Explains how county weather warnings are displayed with color-coded highlights.
Displays weather forecasts, including fronts and precipitation for different time periods.
Guides users on accessing forecasts for the next 12, 24, 36, and 48 hours.
Explains how to view weather forecasts for a specific location by using the map pointer.
Illustrates weather fronts and pressure centers on the chart display.
Shows weather forecasts for cities using standard symbols and 12-hour increments.
Provides information on surface conditions like winds, wave height, period, and direction.
Explains wind barbs and how they indicate wind direction and speed.
Describes the Wave Height feature, showing wave heights via color intensities.
Explains the Wave Period feature, indicating time between successive waves.
Details the Wave Direction feature, showing wave movement via a red arrow.
Displays current water temperature, surface pressure, and fishing forecasts.
Explains pressure isobars and centers for weather and wind condition analysis.
Indicates water surface temperature using a legend and isotherm lines.
Shows areas with optimal weather conditions for specific fish species.
Forecasts maximum horizontal visibility, using a legend and contour lines.
Guides users on accessing visibility forecasts for different time intervals.
Displays readings from buoys and coastal stations for weather and environmental data.
Describes how to listen to XM Audio channels via a connected receiver and the chartplotter interface.
Lists the physical dimensions, weight, display size, and performance metrics of the chartplotter.
Explains compatibility and connectivity with NMEA 0183 and NMEA 2000 devices.
Details how to capture screen images and transfer them to a computer.
Lists and explains various system messages and audible alarms encountered during operation.
Encourages users to register their product online for better support.
Provides contact information for Garmin Product Support in different regions.
States compliance with essential requirements and relevant provisions of EU Directive 1999/5/EC.
Outlines the warranty terms for the provided weather data software.
Advises on safe usage of XM Services and disclaims responsibility for accidents.
Presents the terms and conditions for using the device's embedded software.
Details the service agreement for XM Satellite Radio subscription and features.
| Sport (fitness, running) | No |
|---|---|
| Marine (chartplotters, sounders) | Yes |
| Live service | - |
| Routes quantity | 20 |
| Number of waypoints | 1500 |
| Map view options | 3D |
| Form factor | Fixed |
| Display diagonal | 12.1 \ |
| Display resolution | 1024 x 768 pixels |
| Display size (HxV) (imperial) | 7.3 x 9.7 \ |
| Compatible memory cards | SD |
| Depth | 117 mm |
|---|---|
| Width | 376 mm |
| Height | 241 mm |
| Weight | 4500 g |