6–20 469 MOTOR MANAGEMENT RELAY – INSTRUCTION MANUAL
CHAPTER 6: ACTUAL VALUES
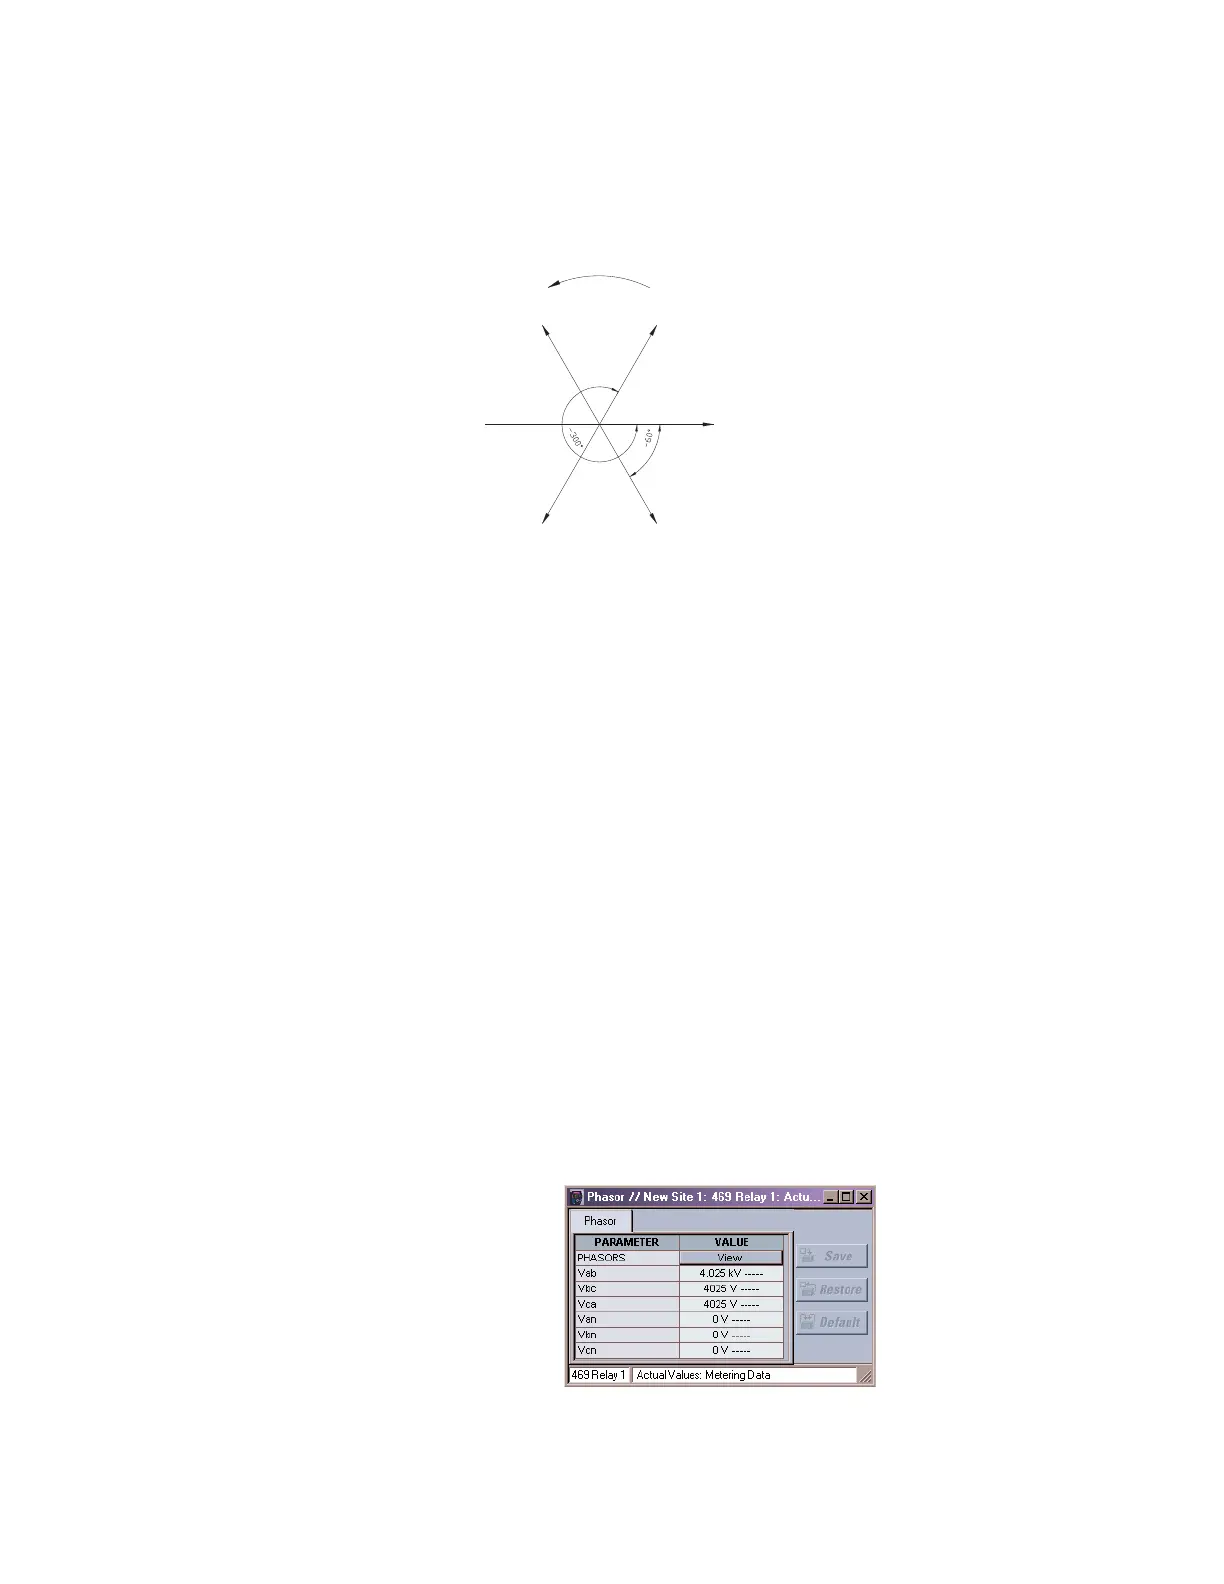
The following phasor diagram presents, in graphic form, the relationship between system
quantities and how they are measured, calculated, and displayed. Note that all angles
shown are negative or lagging angles.
FIGURE 6–6: Typical Phasor Diagram for Open Delta Connection
For example, assume a balanced three phase system with a VT Turn Ratio of 35:1, VT
ratings 4200/120 V, and motor running at full load with a power factor of 0.95 (18.2° angle).
When the measured phase to phase voltage is 115 V, the following quantities are displayed
by the relay and EnerVista 469 Setup software:
In the
A2 METERING DATA ZV VOLTAGE METERING menu:
VAB: “4025 Volts”
VBC: “4025 Volts”
VCA: “4025 Volts”
AVERAGE LINE VOLTAGE: “4025 Volts”
SYSTEM FREQUENCY: “60.00 Hz”
In the
A2 METERING DATA ZV PHASORS menu:
VA PHASOR : “95.8% at 0° Lag”
VB PHASOR: “0.0% at 48° Lag”
VC PHASOR: “95.8% at 300° Lag”
IA PHASOR: “100.0% at 48° Lag”
IB PHASOR: “100.0% at 168° Lag”
IC PHASOR: “100.0% at 288° Lag”
The EnerVista 469 Setup software displays the following screen for
A2 METERING DATA ZV
PHASORS
values:
806556A1.CDR
Vca
VA=Vab
Vbc
VC=–Vbc
Vac
Phase Rotation
System Voltages:
Vab
Vbc
Vca
Measured Voltages:
Vab = VA (G2–G1)
–Vbc = VC (H2 – G1)
Calculated Voltage:
Vac = Vab + Vbc
Displayed Voltages:
Va = Vab
Vb =0°
Vc =–Vbc