Table of Figures
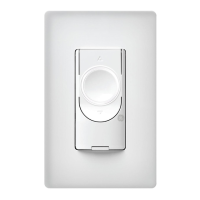
Figure 1: T1000 Communication modules 39
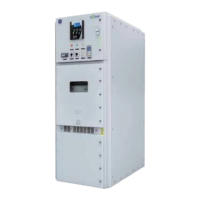
Figure 2: T1000 Switch 40
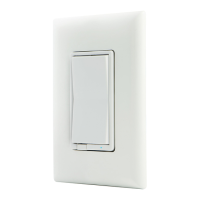
Figure 3: S2020 Switch 40
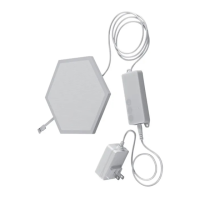
Figure 4: S2024G Switch 41
Figure 5: Hardware architecture overview 42
Figure 6: NTP Time Protocol Mechanism 46
Figure 7: NTP Syslog Message Basics 47
Figure 8: Ports at a Transparent Bridge 48
Figure 9: Example of the SNMP management architecture 52
Figure 10: Comparison between common and aggregated links speed 53
Figure 11: Link failure behavior of an aggregated link 54
Figure 12: Load balancing in aggregated links 55
Figure 13: Bridge Loop 56
Figure 14: Usage situations for Loop Protection 57
Figure 15: BPDU Packet 59
Figure 16: Ring topology LAN and possible paths for data traffic from IED A to IED B 60
Figure 17: Example of a loop-topology showing bridge 61
Figure 18: Logical topology after the Spanning Tree protocol was executed 61
Figure 19: Port states in the Spanning Tree Protocol 62
Figure 20: STP protocol mechanism and maximum port changing time 63
Figure 21: Port states when STP protocol is used in a ring physical topology 64
Figure 22: Failure on the designated link of the Spanning tree 64
Figure 23: Reconfigured topology after a designated link failure 64
Figure 24: RSTP protocol mechanism 65
Figure 25: RSTP port status in a loop topology 66
Figure 26: RSTP edge and truck ports 66
Figure 27: BPDU flag field at RSTP protocol 67
Figure 28: MSTP regions and legacy RSTP LAN connection 68
Figure 29: CIST roots an MSTP regions and legacy RSTP LAN 69
Figure 30: MSTP regions behavior using RSTP protocol 69
Figure 31: RSTP recovery table 70
Figure 32: Network fault recovery using GE Reason Switches 70