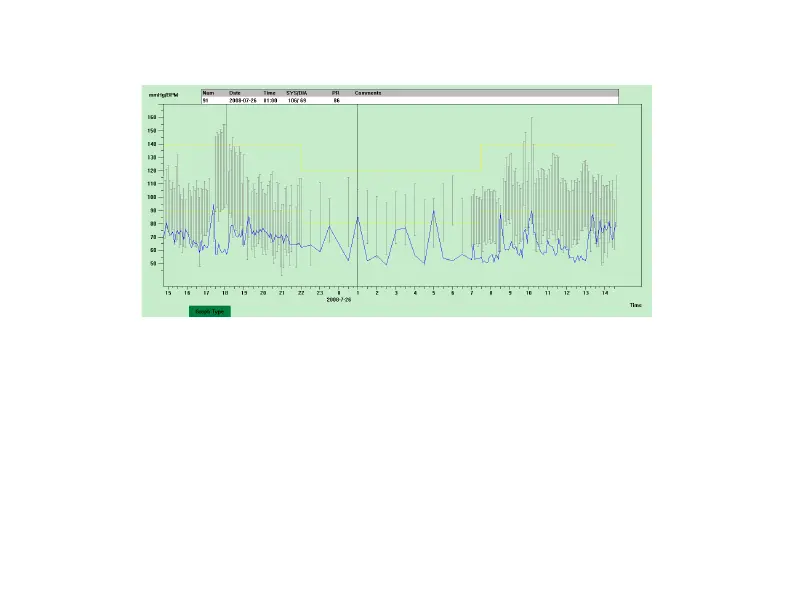
Figure 6.10.2 Dotted Line Trend Graph
You can switch the two trend graph types by "Graph Type" button in the bottom of the software
interface. When you move the mouse on the trend area, the detail data information on this location
will display in the top of the tread area, including the data serial number, collection time and
collection date, high/low blood pressure value, pulse rate, comment, etc. Press mouse' left button to
delete or add the data point to be shown.