It will take time for the analyzer to
browse an old history point. The longer
time you want to go back, the longer
time the analyzer will require to recall
the history. When the analyzer is re-
calling history, the touch screen will
freeze and will not immediately react
to touching.
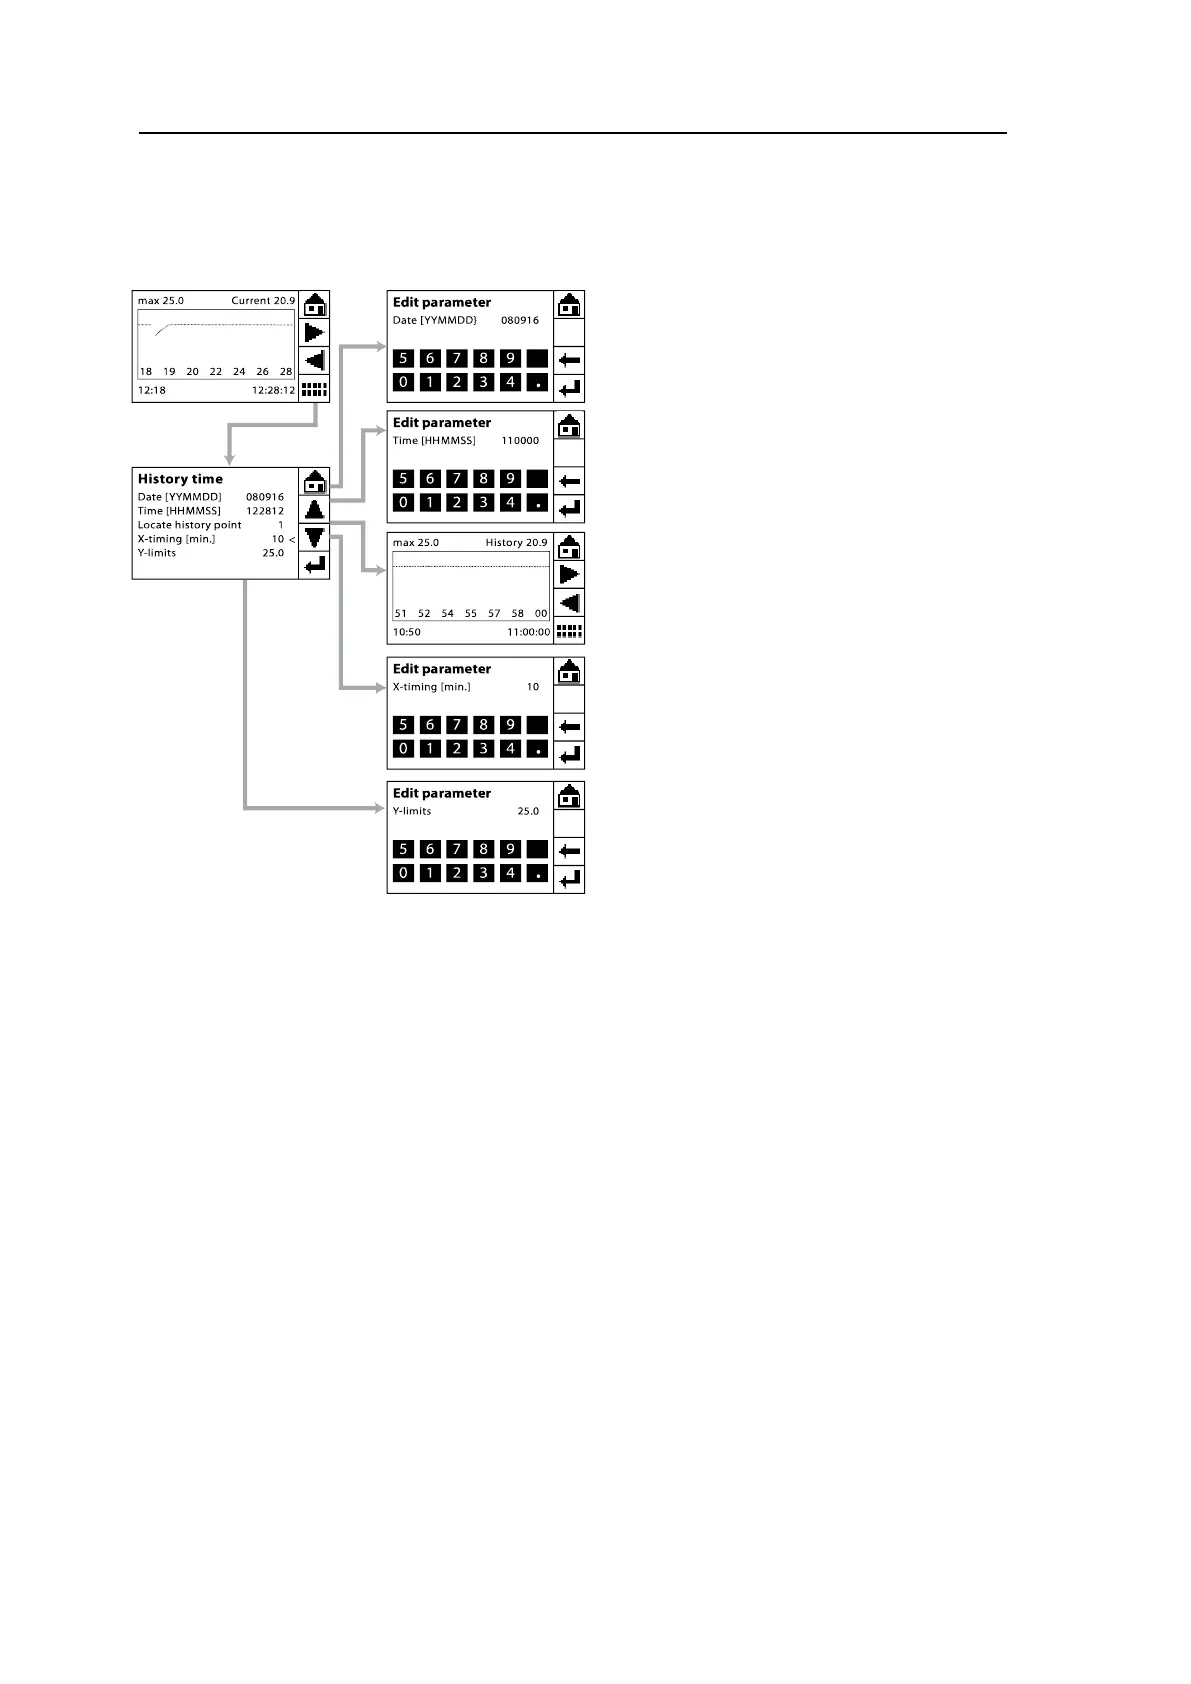
If you want to browse a history point
that dates back more than a week, it
will be best to read the history data di-
rectly from the log file at the SD card.
For details of how to read the log file,
please refer to section 3.4.6.
X-timing shows the time range of the
trending graph, which can be set as re-
quired. However, the time range
should not be over 1440 minutes (24
hours). The time range is displayed on
the lower part of the graph screen with
the starting point in the bottom left
corner and the ending point in the bot-
tom right corner.