57
Standard Operations
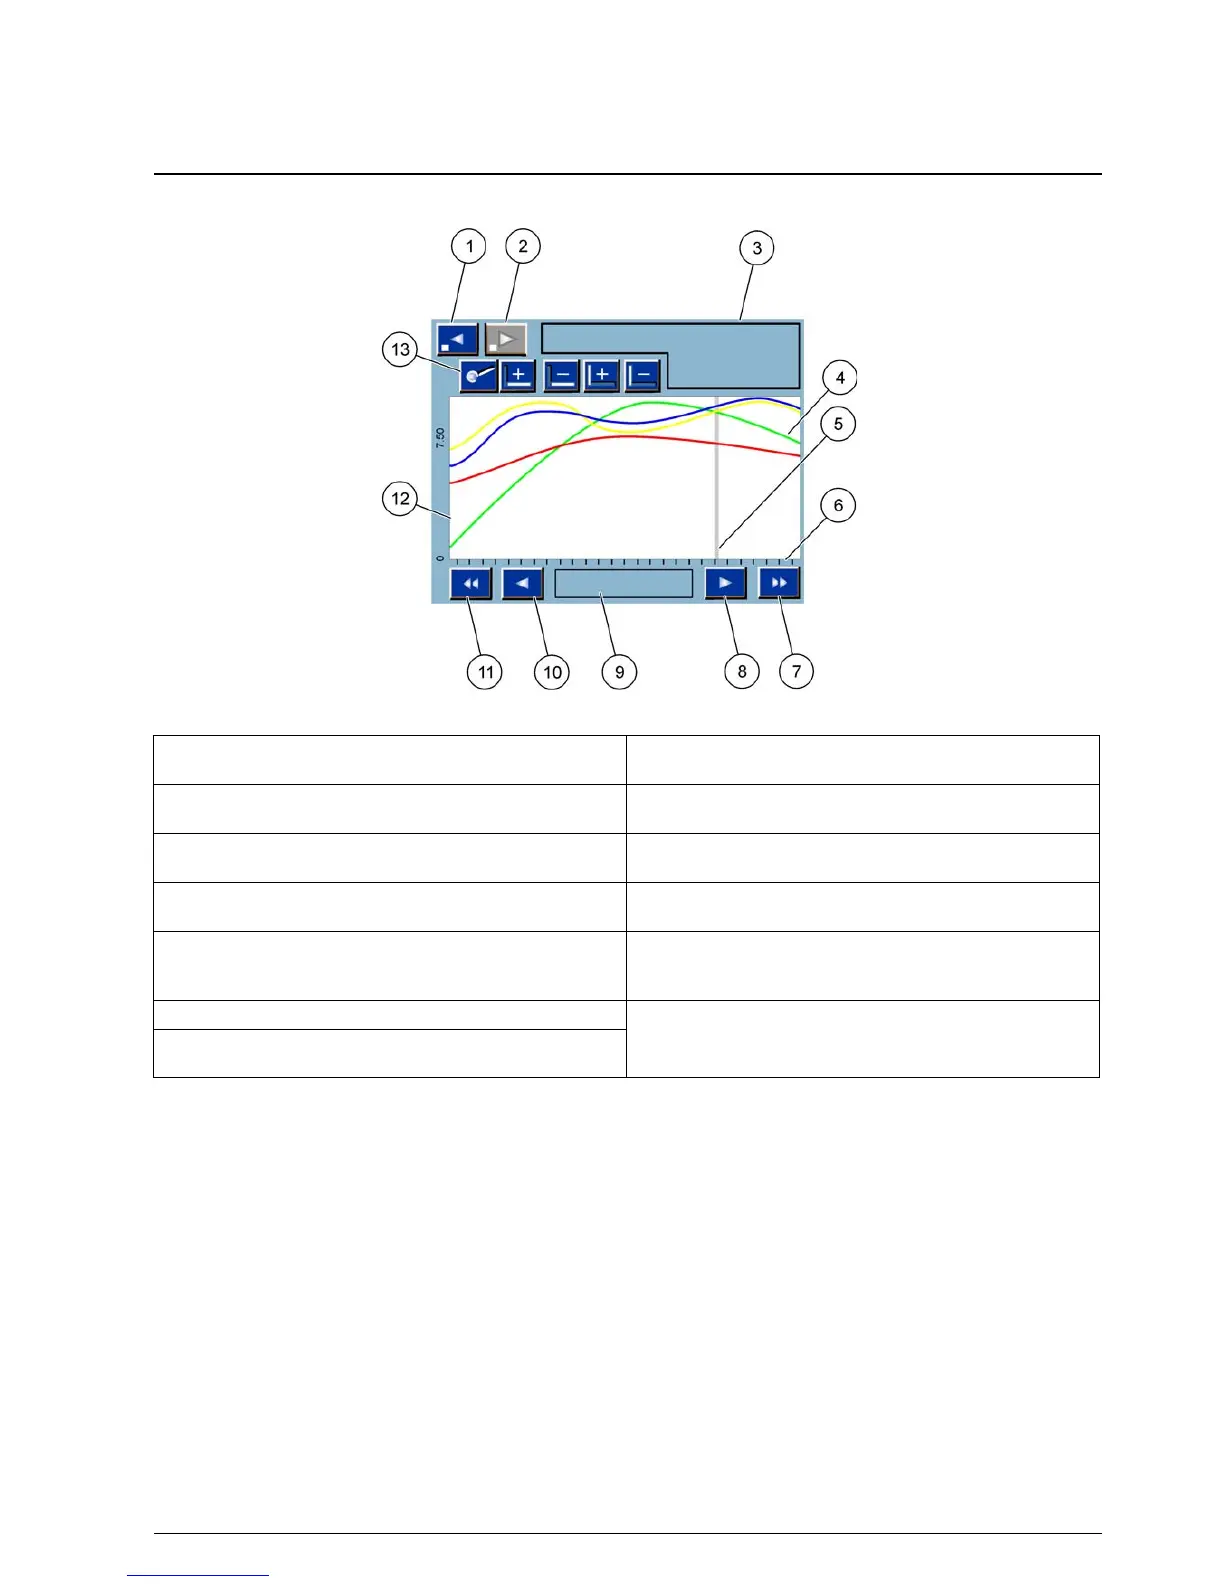
Note: Tap the left side of the of the curve window to display the parameter axis. With every tap the
axis for the next curve is displayed. It is not possible to display all parameter axis at the same time.
Figure 40 The Graph display
1 LEFT step button—Moves one step back in history 8 RIGHT arrow button—Moves to the right in the displayed
part of the curve
2
RIGHT step button—Moves one step forward in history 9 Date and time field—Displays the date and time of the
current cursor position (measurement time)
3 Device field—Displays the connected devices 10
LEFT arrow button—Moves to the left in the displayed
part of the curve
4 Curves
1
—Displays the daily/weekly history for
measured values of connected devices
11 LEFT scroll button—Scrolls the screen over the whole
curve
5 Cursor—Cursor is placed at the current measured value.
Cursor position can be changed with the
LEFT/RIGHT
scroll buttons.
12 Y-axis
6 X-axis 13
ZOOM button—Opens zoom bar for zoom functions
7
RIGHT scroll button—Scrolls the screen over the whole
curve
1
The curves are displayed with an optimal scaling. This optimal scaling displays all values between the minimum and
maximum range.