LP-428 Rev. 6.6.16
16
The chart below represents various system design temperature rise through the boiler along with respective ows and friction
loss. This is provided to aid in circulator selection.
System Temperature Rise Chart
20°Δt 25°Δt 30°Δt
Model Friction Ft Flow Rate (GPM) Friction Ft Flow Rate (GPM) Friction Ft Flow Rate (GPM)
MODCON1000 19’ 100 11’ 80 8’ 66
MODCON1700 35’ 170 26’ 130 18’ 109
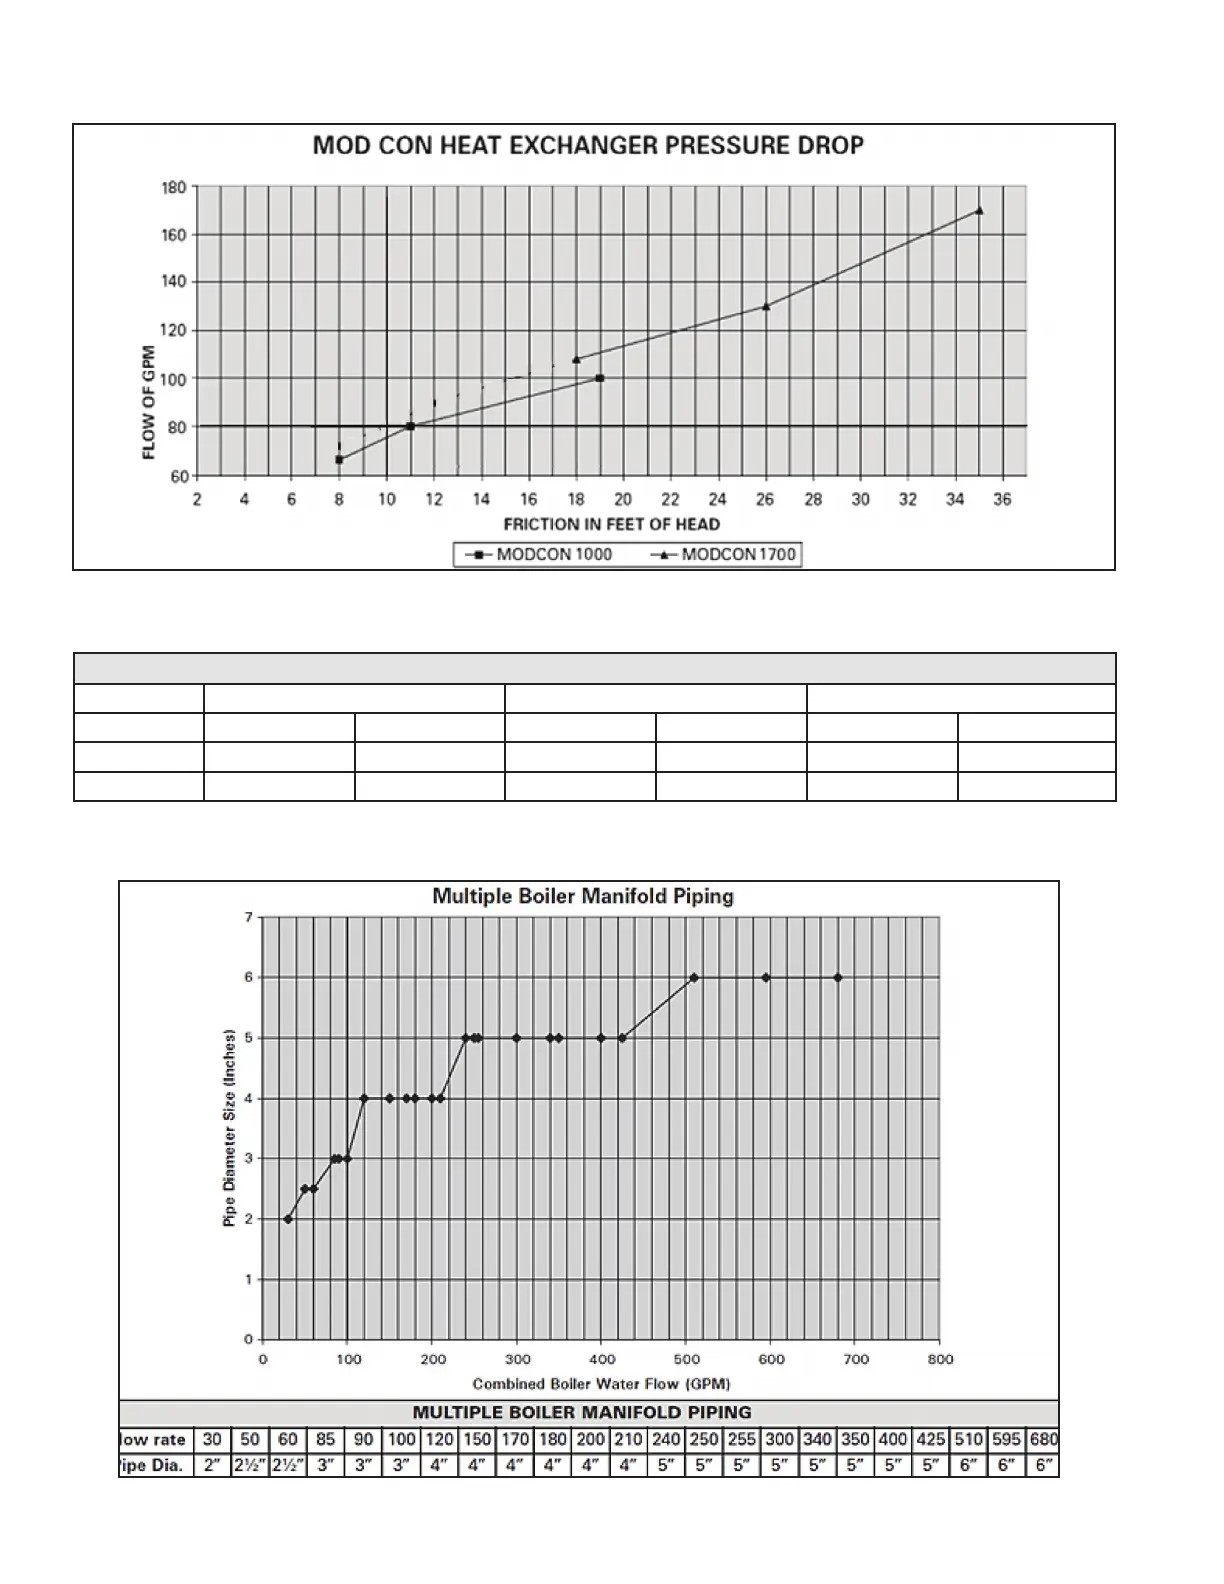
Table 4 - Heat Exchanger Pressure Drop
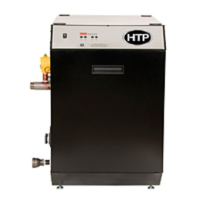
Table 5 - Multiple Boiler Manifold Piping
Table 6 - Temperature Rise, Friction Ft, and Flow Rate
The boiler heat exchanger does have a pressure drop which must be considered in system design. Refer to the graph in Table 4
for pressure drop through the boiler heat exchanger.
The chart below represents the combined ow rates and pipe sizes when using multiple boilers to design the manifold system
for the primary circuit. To size, simply add the number of boilers and the required ow rates for the system design temperature.