56 57
Within ± 0.83 mmol/L and Within ± 15%
599/600 (99.8%)
System accuracy results for glucose concentrations between
2.1 mmol/L and 29.5 mmol/L
Packed Cell Volume (Hematocrit)
The hematocrit levels (15 ~ 65%) were tested to evaluate the effect
of hematocrit level on measurement of glucose concentration.
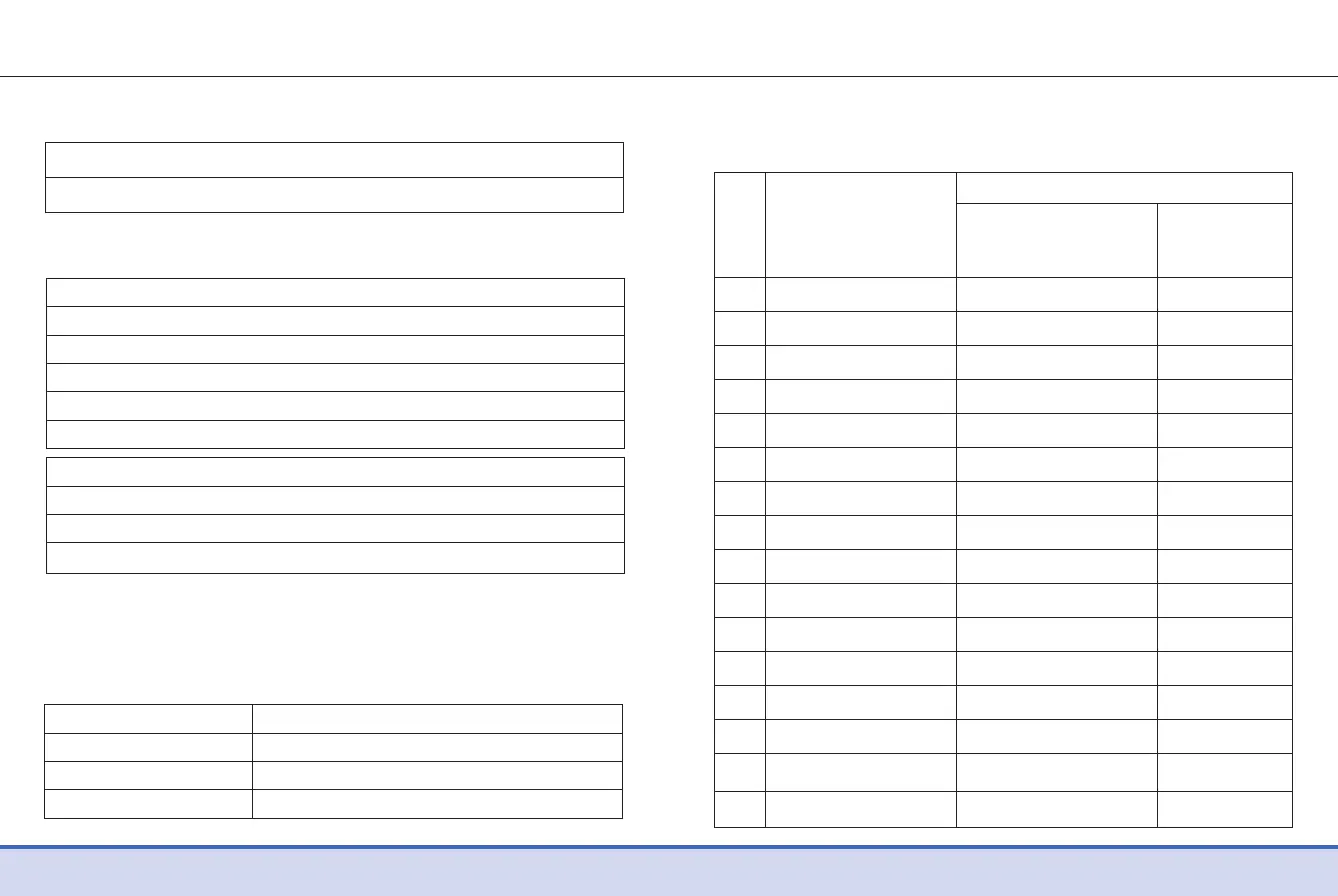
Difference Averages
NO Interferent
1 Ascorbic acid -0.1 mmol/L 0.0 %
2 Bilirubin 0.1 mmol/L 1.3 %
3 EDTA 0.1 mmol/L 1.4 %
4 Fructose 0.1 mmol/L -0.3 %
5 Galactose -0.1 mmol/L -0.2 %
6 Haparin -0.04 mmol/L -0.8 %
7 Maltose -0.1 mmol/L -1.4 %
8 Maltotriose -0.03 mmol/L -0.1 %
9 Maltotetraose 0.02 mmol/L -0.7 %
10 Mannose -0.1 mmol/L 3.5 %
11 Xylose 1.9 mmol/L 8.9 %
12 2-deoxyglucose 0.1 mmol/L 0.2 %
13 Acetaminophen -0.1 mmol/L 2.7 %
14 Cholesterol 0.04 mmol/L -0.3 %
15 Creatinine 0.01 mmol/L -1.9 %
16 D,L-arabinose 0.1 mmol/L 3.1 %
Interval 1 Interval 2
2.8–5.5 mmol/L
13.9–19.4 mmol/L
Interferences
The effect of various interfering substances was evaluated in
whole blood samples on glucose measurements.
Within Run Precision
*Bloodav 2.1 mmol/L SD = 0.1 mmol/L
*Bloodav 4.2 mmol/L SD = 0.1 mmol/L
*Bloodav 7.2 mmol/L CV = 3.4%
*Bloodav 11.4 mmol/L CV = 3.2%
*Bloodav 17.9 mmol/L CV = 3.0%
Precision: The precision studies were performed in a laboratory
using Nipro Premier alpha BGM Systems.
Between Run Precision
*Controlav 2.2 mmol/L SD = 0.1 mmol/L
*Controlav 6.4 mmol/L CV = 2.9%
*Controlav 19.3 mmol/L CV = 3.0%
This study shows that there could be variation of up to 3.2%.
1.7 to 2.8 -0.3 to 0.4 mmol/L
5.3 to 8.0 -7.9 to 6.0%
15.5 to 23.3 -8.9 to 5.9%
Range (mmol/L)
Average of difference (Hct 15–65%)
 Loading...