58 59
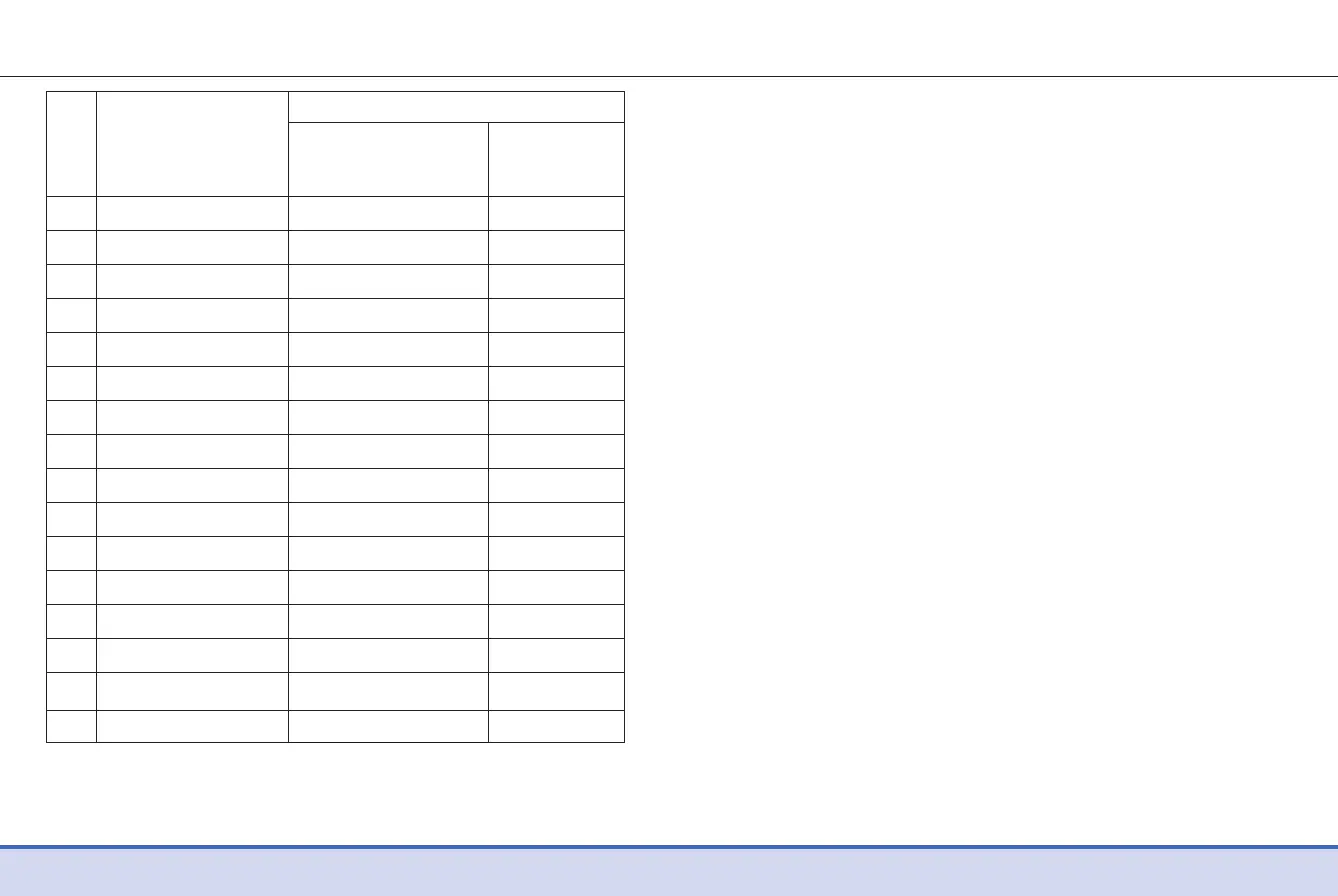
Difference Averages
NO Interferent
17 Dopamine 0.02 mmol/L -0.3 %
18 Gentisic acid 0.04 mmol/L 2.7 %
19 Glucosamine -0.1 mmol/L -2.7 %
20 Glutathione (Red) -0.1 mmol/L -0.8 %
21 Hemoglobin -0.3 mmol/L -2.8 %
22 Ibuprofen 0.1 mmol/L -0.9 %
23 Icodextrin -0.2 mmol/L -0.4 %
24 L-DOPA -0.1 mmol/L 0.0 %
25 Methyl-DOPA -0.1 mmol/L -1.4 %
26 Sodium salicylate 0.1 mmol/L 3.7 %
27 Sucrose -0.02 mmol/L -1.1 %
28 Tolazamide -0.02 mmol/L 0.5 %
29 Tolbutamide 0.1 mmol/L 3.5 %
30 Triglyceride -0.03 mmol/L 0.5 %
31 Uric acid -0.03 mmol/L -0.6 %
32 PAM -0.1 mmol/L 1.6 %
Interval 1 Interval 2
2.8–5.5 mmol/L
13.9–19.4 mmol/L
* The Xylose was higher than 0.55 mmol/L in interval 1. After
conduction dose-response testing for Xylose, the maximum
interferent concentration in interval 1 was calculated as 0.54
mmol/L
User Performance Evaluation
A study evaluating glucose values from fingertip capillary blood
samples obtained by 100 lay persons showed the following
results:
100% within ± 0.83 mmol/L of the medical laboratory values at
glucose concentrations below 5.55 mmol/L, and 100% within
±15% of the medical laboratory values at glucose concentrations
at or above 5.55 mmol/L.
 Loading...