5 Create and download project
29
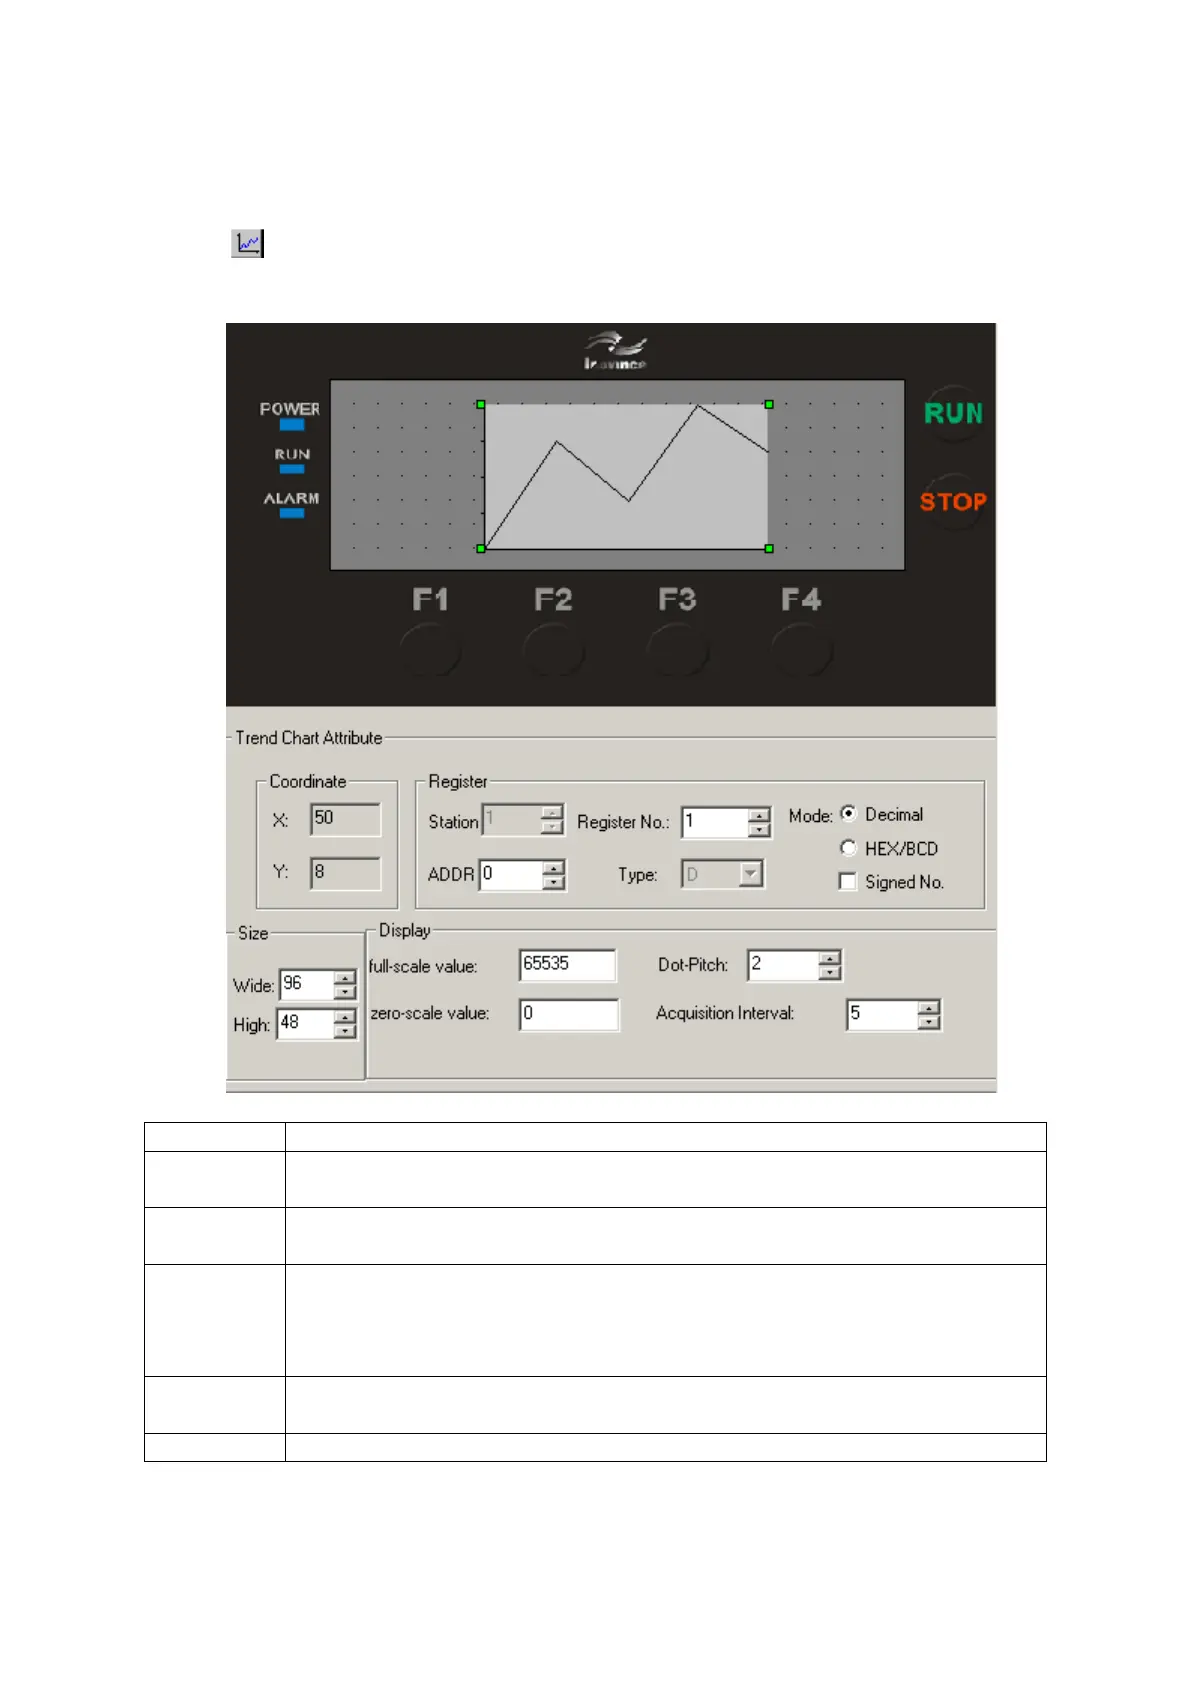
4.7 Trend chart
In the process of industrial control, some parameters change slowly. In order to understand the
change process of these parameters in a certain period of time, a trend chart can be established.
Click the control button, a rectangular dashed frame that moves with the mouse appears on
the screen, move to the proper position and press the left mouse button to confirm.
The register address corresponding to the trend graph.
When the trend graph is displayed on 100% scale, the value corresponding to
the register.
When the trend graph is displayed at 0% scale, the value corresponding to the
register.
The total number of sampling points from left to right in the entire trend graph.
The larger the value, the faster the line chart changes, and of course the time
will be longer. Maximum dot pitch = width - 2. If the segment degree is 94, the
highlight data range that can be set is 2~92.
The interval between every two sampling points.
This value determines the length and width of the line chart.
Note: A trend chart control can only display one polyline.
 Loading...