TEST RESULTS
On completion of the tympanometry test sequence, the relative screen will
display the data acquired by the instrument and the relative numerical
results.
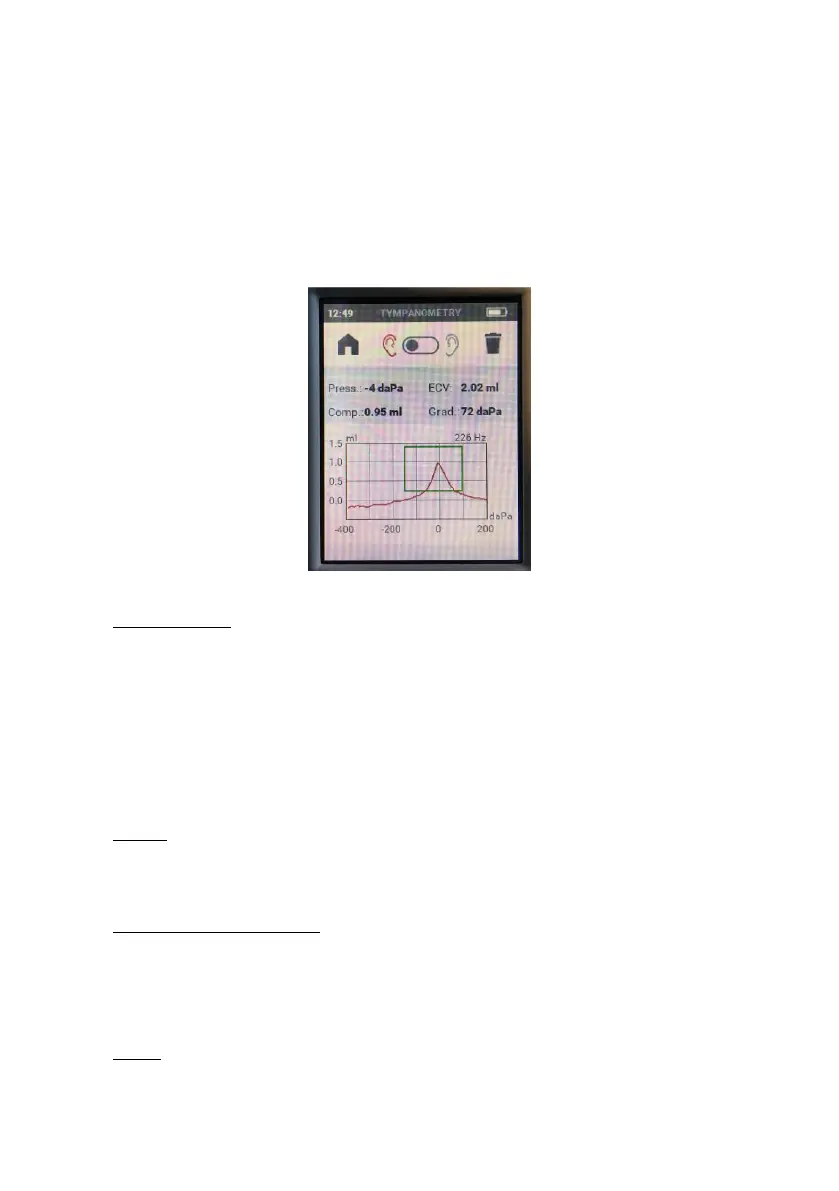
The results of the test consist in a graph — the tympanogram — and, shown
above the graph, measurements of the typical parameters.
Tympanogram
The tympanometry graph shows the variation in acoustic admittance in
response to pressure. If a 226 Hz probe tone is being used, the vertical axis
indicates the acoustic admittance of an equivalent volume of air, expressed
in ml. If a 1 kHz probe tone is being used (see section on 1000 Hz
tympanometry), the vertical axis indicates acoustic admittance expressed in
mmho. The horizontal axis indicates meatus pressure in relation to ambient
pressure, expressed in daPa.
Comp.
Amplitude of the tympanogram peak measured against ECV, expressed in
ml (millilitres).
ECV (Ear Canal Volume)
Compliance value in ml measured at the maximum value of the pressure
range selected for the scan. This value is also called the "equivalent
volume".
Press.