i-ALERT2 Application Guide 36 of 64
To change the trend chart to show a longer time frame, tap the “Weekly” button above the chart. This will change the chart
to display the last 4 weeks of trend data. To view the numerical values instead of the graphical trend, tap the icon that looks
like an arrow pointing up next to the devices name. See figure 32. To return to the graphical trend, click the “DONE” button
at the top left.
If you would like to export the numerical data click on the up arrow icon at the bottom left of the page. (Note: the upload
icon may not always be at the bottom left, in some cases it is at the upper right. Regardless of location the function remains
the same.) See figure 32. You will have a choice to print it directly to a local printer, or attach it to an email in the CSV file
format. CSV files are universal and can be imported to plant historians or opened with a spreadsheet processing program.
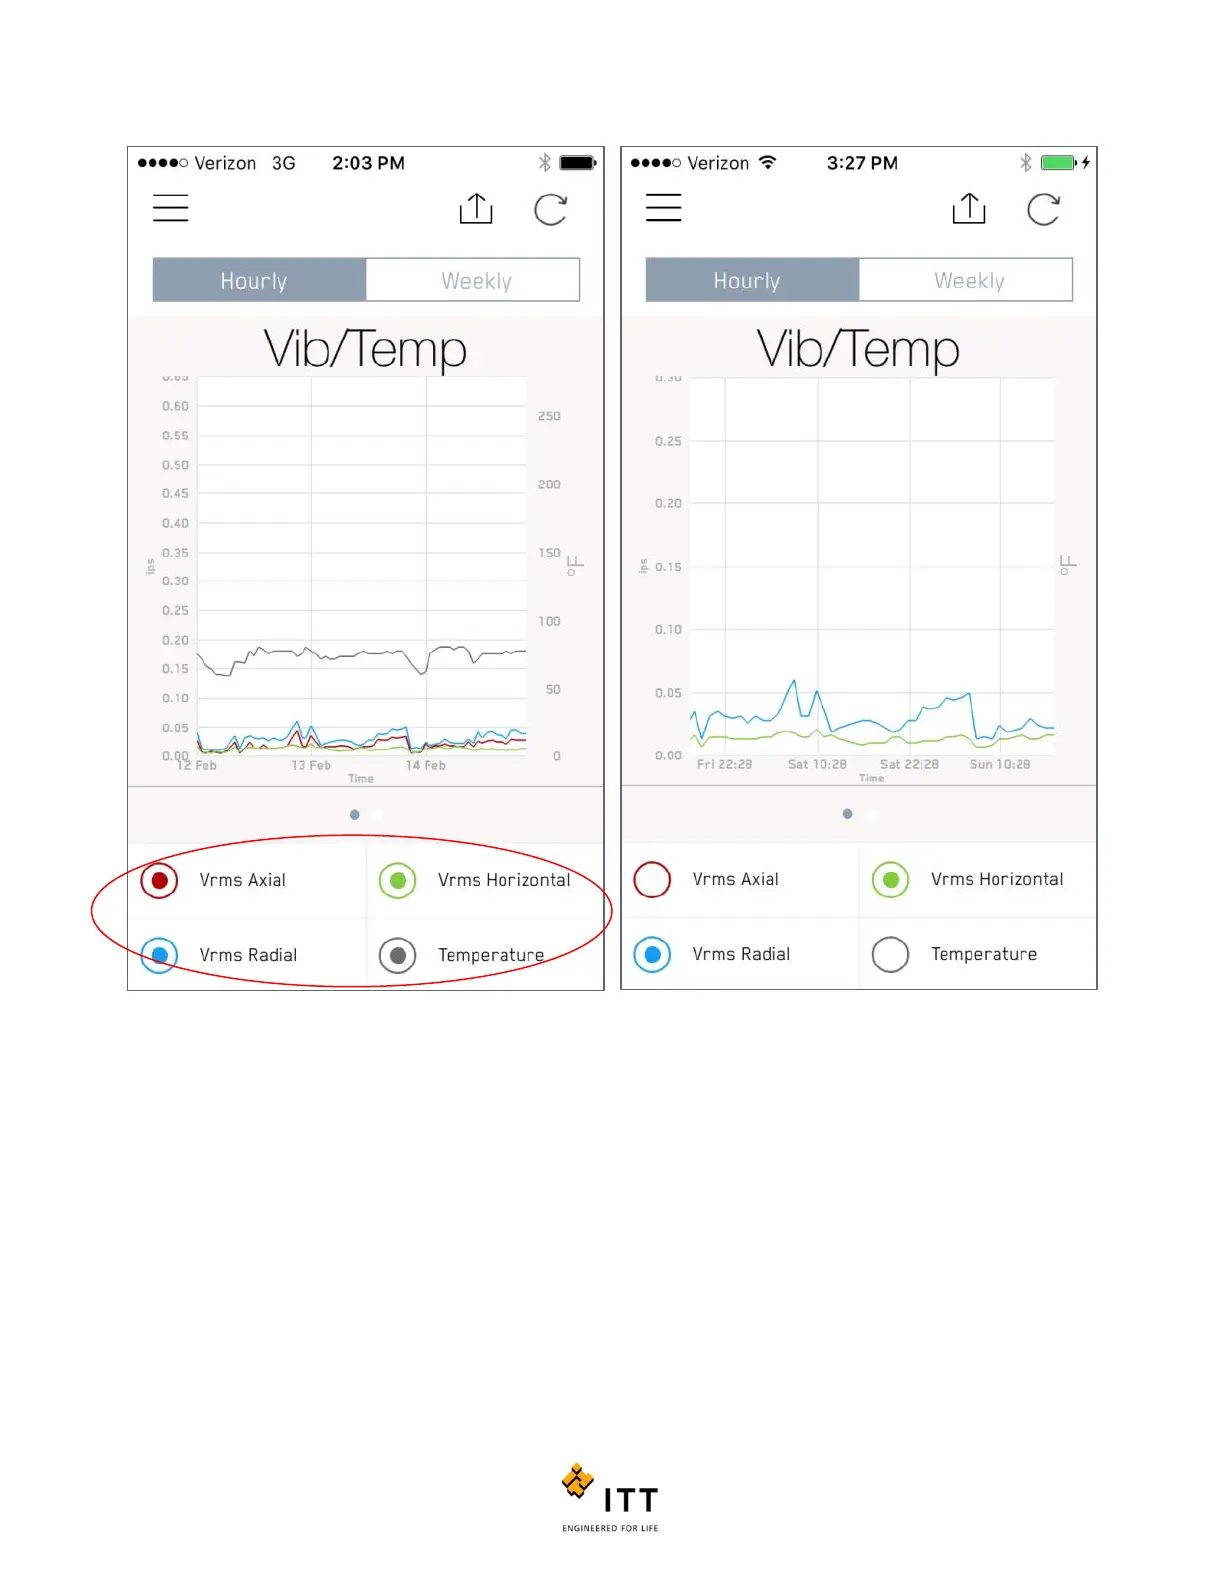
Figure 31: Default Trend view on left, Trend view with several measurement de-selected shown on the right.