BASIC DMM OPERATION
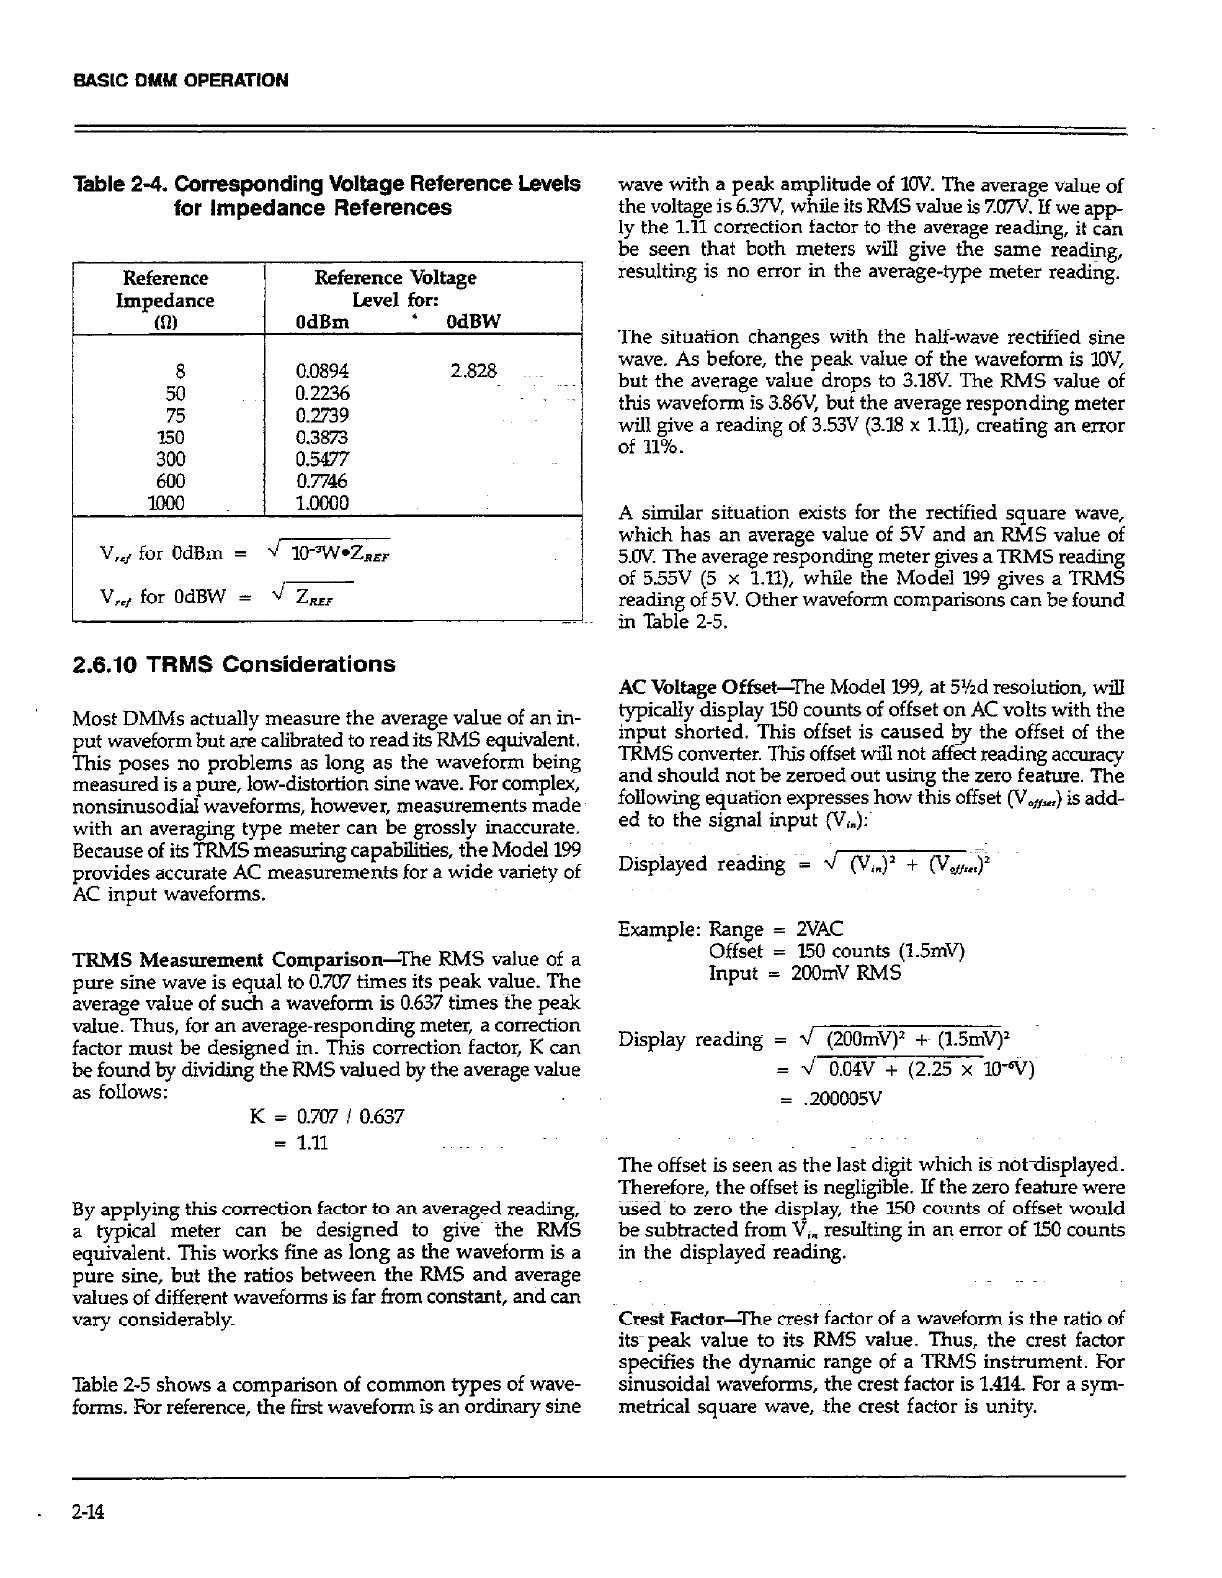
Table 2-4. Corresponding Voltage Reference Levels
for Impedance References
Reference
Impedance
W)
8
50
75
150
300
600
lml
I
Reference Voltage
Level for:
OdBm ’ OdBW
0.0894 2.828
0.2236
0.2739
0.3873
0.5477
0.7746
1.0000
I
V,, for OdBm = q 10~‘W*Z,,
V,, for OdBW = 4 Z.,
I.
2.6.10 TRMS Considerations
Most DMMs actually measure the average value of an in-
put waveform but are calibrated to read its RMS equivalent.
This poses no problems as long as the waveform being
measured is a pure, low-distortion sine wave. For complex,
nonsinusodial waveforms, however, measurements made
with an averaging type meter can be grossly inaccurate.
Because of its TRMS measuring capabilities, the Model 199
provides accurate AC measurements for a wide variety of
AC input waveforms.
TRMS Measurement Comparison-The RMS value of a
pure sine wave is equal to 0.707 times its peak value. The
average value of such a waveform is 0.637 times the peak
value. Thus, for an average-responding meter, a correction
factor must be designed in. This correction factor, K can
be found by dividing the RMS valued by the average value
as follows:
K = OX7 / 0.637
= 1.11
By applying this correction factor to an averaged reading,
a typical meter can be designed to gives the RMS
equivalent. This works fme as long as the waveform is a
pure sine, but the ratios between the RMS and average
values of different waveforms is far from constant, and can
vary considerably.
Table 2-5 shows a comparison of common types of wave-
forms. For reference, the first waveform is an ordinary sine
wave with a peak amplitude of NV. The average value of
the voltage is 6.37V while its RMS value is 7UV. If we app-
ly the 1.11 correction factor to the average reading, it can
be seen that both meters will give the same reading,
resulting is no error in the average-type meter reading.
The situation changes with the half-wave rectified sine
wave. As before, the peak value of the waveform is lOV,
but the average value drops to 3.18V. The KMS value of
this waveform is 3&V, but the average responding meter
will give a reading of 3.53V (3.18 x 1X), creating an error
of 11%.
A similar situation exists for the rectified square wave,
which has an average value of 5V and an F&IS value of
5.OV. The average responding meter gives a TRMS reading
of 5.55V (5 x Ill), while the Model 199 gives a TRMS
reading of 5V. Other waveform comparisons can be found
in Table 2-5.
AC Voltage Offset-The Model 199, at 5&d resolution, will
typically display 150 counts of offset on AC volts with the
input shorted. This offset is caused by the offset of the
TENS converter. This offset will not affect reading accuracy
and should not be zeroed out using the zero feature. The
following equation expresses how this offset (V+,) is add-
ed to the signal input (V,.):~
Example: Range = 2VAC
Offset = 150 counts (1.5mV)
Input = 2COmV RMS
Display reading = -V)’ +~ (l.Smv)>
= J 0.04v + (2.25 x 10%)
= .200005V
The offset is seen as the last digit which is not-displayed.
Therefore, the offset is negligible. If the zero feature were
used~ to zero the display, the 150 counts of offset would
be subtracted from Vi. resulting in an error of I50 counts
in the displayed reading.
Crest Factor-The crest factor of a waveform is the ratio of
itspeak value to its RMS value. Thus, the crest factor
specifies the dynamic range of a TRMS instrument. For
sinusoidal waveforms, the crest factor is 1.414. For a sym-
metrical square wave, the crest factor is unity.
2-14