KIC 2000 v2.4.0.x
38 KIC 2000 User Manual
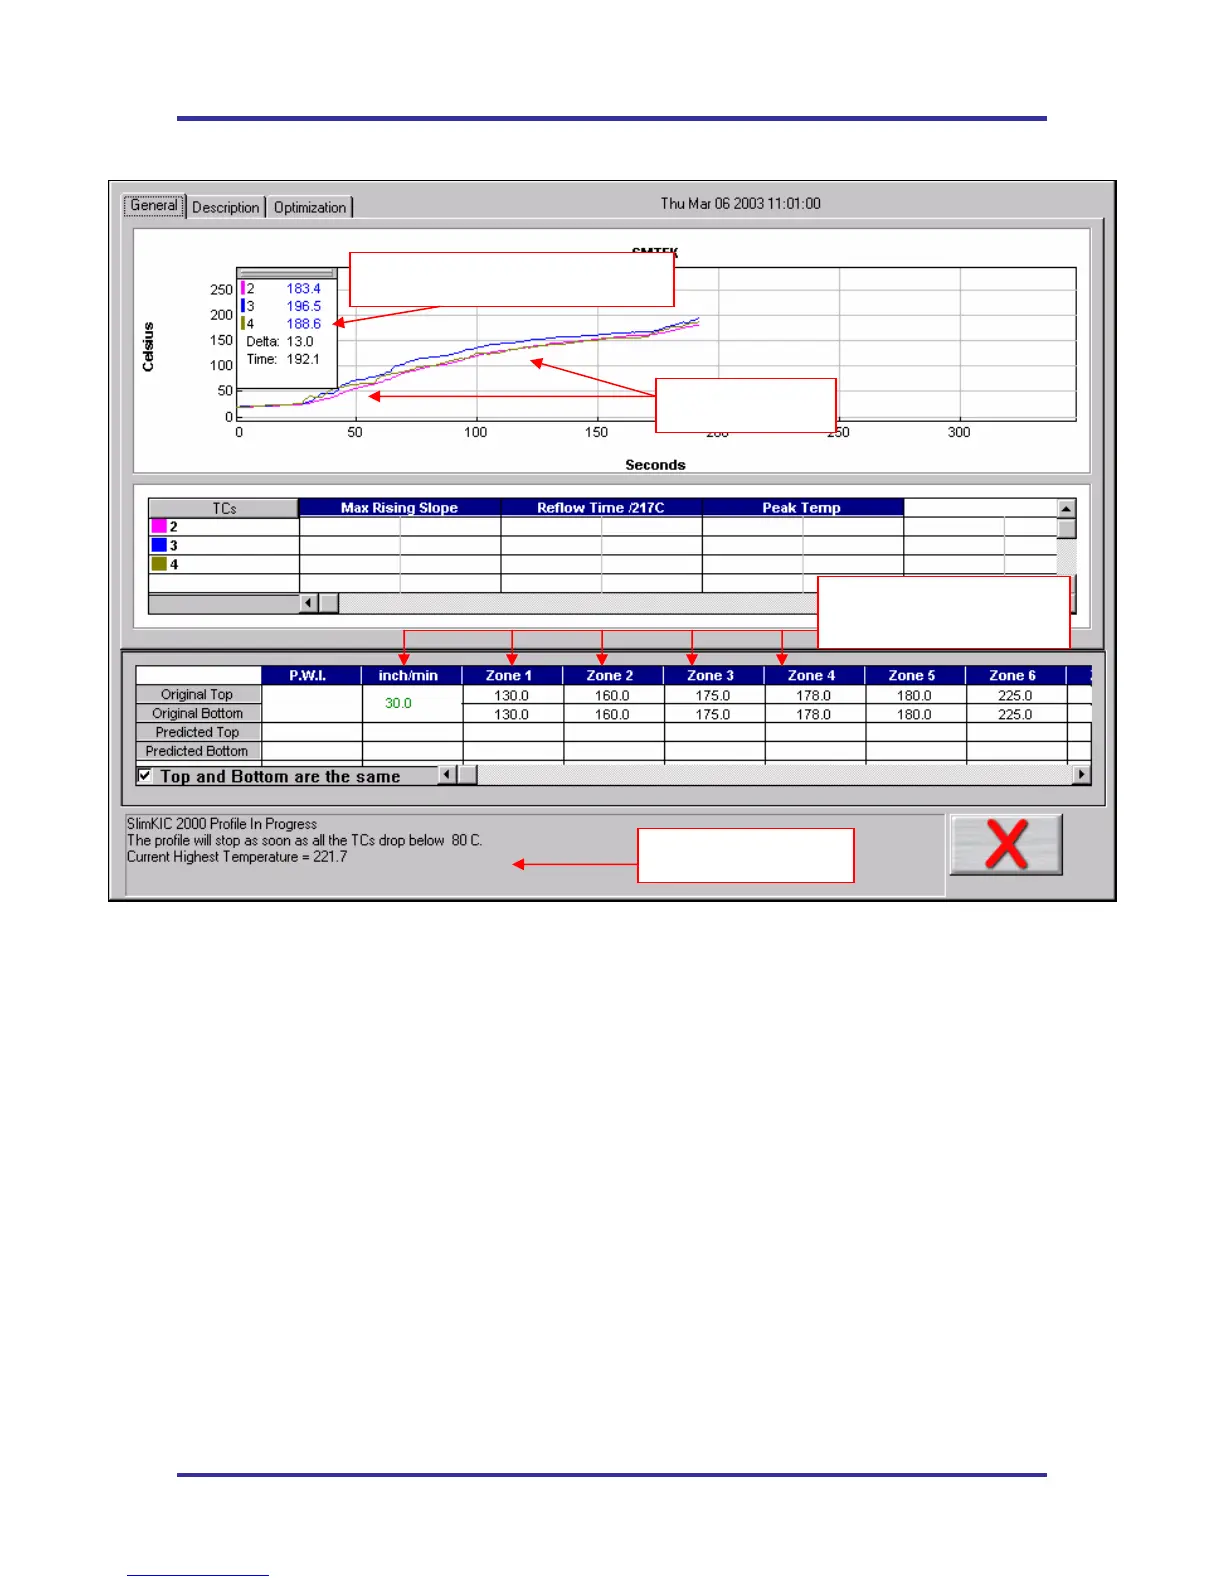
Live Profile Graph Display
Figure 59: Live Profile Graph Display
The Live Graph screen shows the real-time plot of the product going through the oven. This will only
appear for the KIC profiler-RF models or for Temp vs. Time profiles. See Figure 59. During the live
profile all of the tabs on the screen are inaccessible. The only action that you can take at this point is to
cancel the profile by clicking on the RED X button or the Profile Stop button for Temp vs. Time.
The Live Profile Graph display will remain on your screen until the KIC Profiler has achieved the trigger
temperature that determines the profile end.
Profile Status
The bottom part of the screen will keep you apprised of the progress of the profile in reference to the KIC
Profiler hardware status.
• Waiting for the Air TC to exceed the start trigger temperature.
• Profile started- Waiting for the Air TC to exceed the midpoint trigger temperature.
• Profile will stop when all thermocouples drop below 80 Celsius.
• SlimKIC currently retransmitting.
• SlimKIC retransmission successful!
Live temperature readings and Delta
Temperature plots
Oven temperature settings
and conveyor speed.
Live profile status