KIC 2000 v2.4.0.x
KIC 2000 User Manual 45
Automatic Calculation of Delta T + Delta (or range) for all Stats
The software will automatically calculate, and display in the statistical chart, the Delta for both the original
and predicted profile data for all TC’s for all Statistics. See Figure 73. This is the range of the highest to
the lowest value for any given specification. This information is strictly being displayed and is not factored
in to the PWI value and is not used in the Navigator or Auto-focus calculations. Note: For more
information on minimizing the Delta T, please refer to the Application Note on our web site at
www.kicthermal.com
under the “Library”section: AN#20001 - Minimizing Reflow Temperature
Differentials (∆T) on Electronic Assemblies Using the KIC Navigator.
Pointer Tool
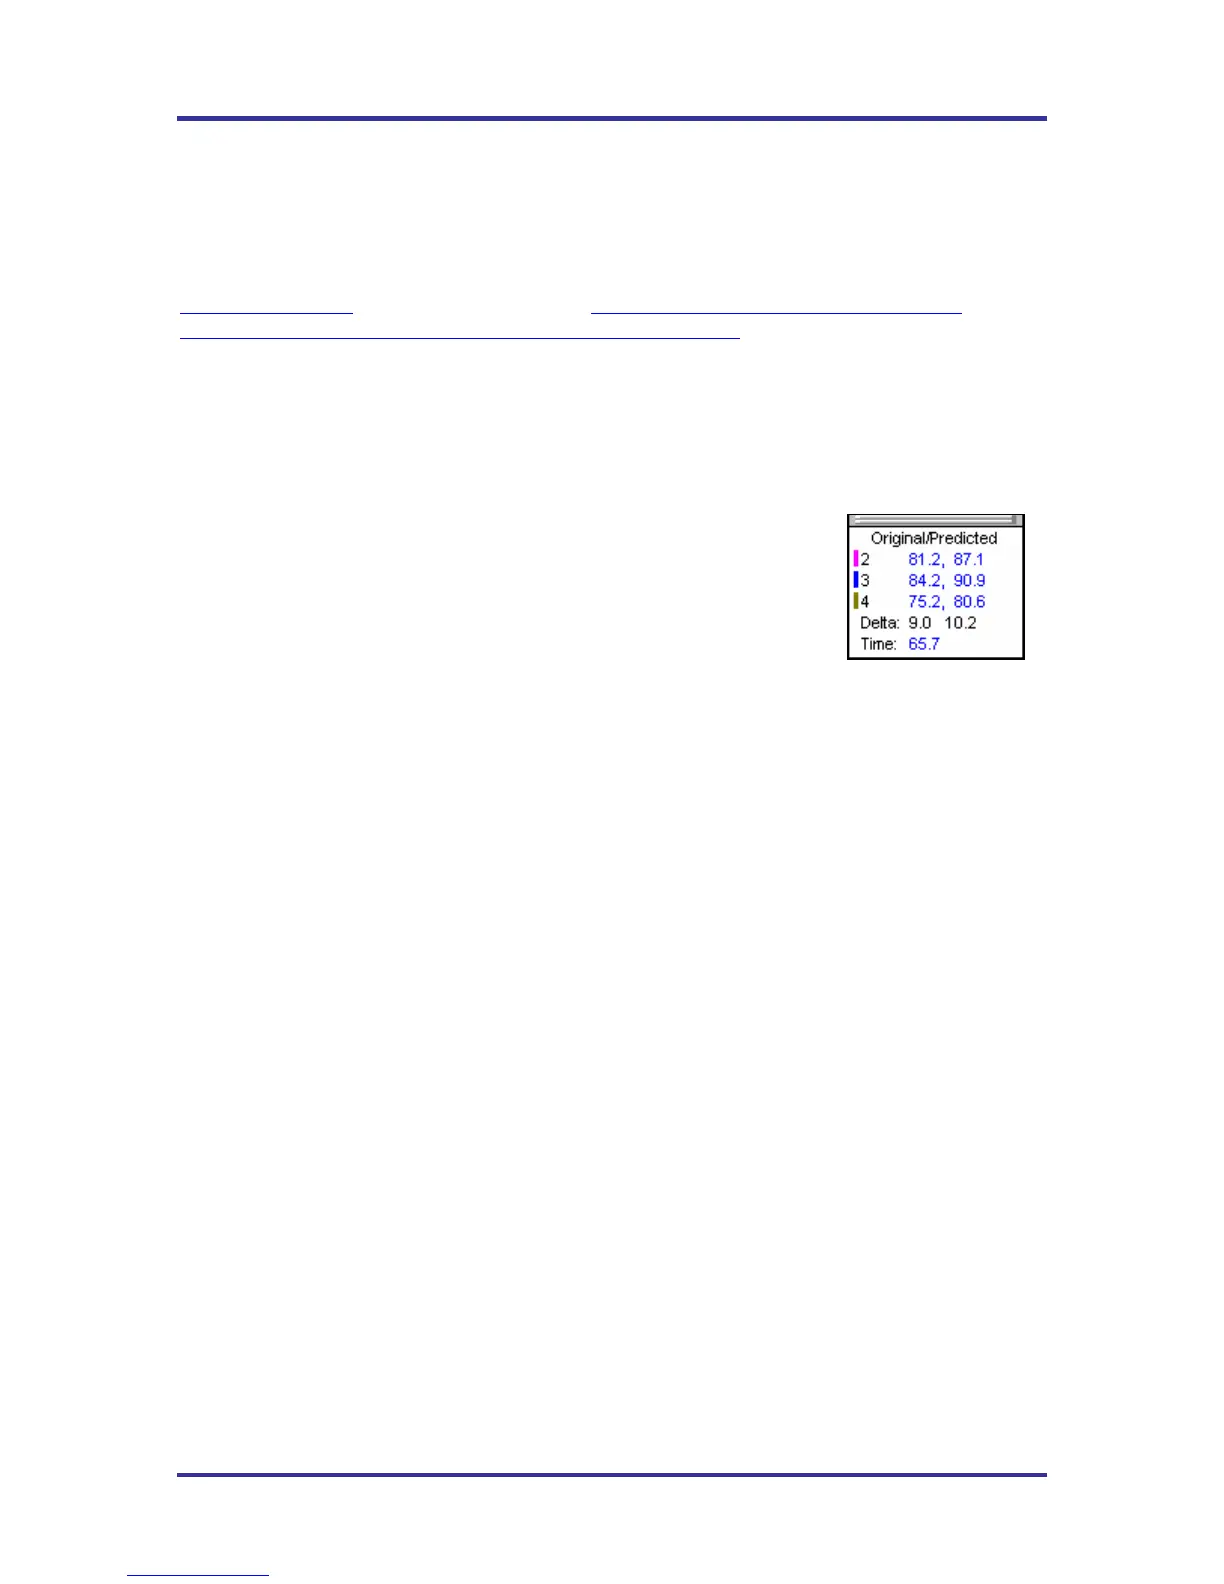
You can also view the Delta T (∆T), or Delta Temperature, at specific points across the profile by right
mouse clicking on the graph. This will bring up a Pointer and a chart will appear in the upper left corner of
the graph. See Figure 73.
Wherever the pointer is moved across the profile, the following data will be
displayed:
• The first column is the actual temperature for each TC.
• The second column is the temperature of the predicted profile data –
based on set point or belt speed changes.
• The Delta T for both actual and predicted TC data.
• The time during the profile at which the pointer is placed
Profile Screen Buttons
There are four buttons at the bottom of the profile screen.
Edit/Define Process Window – Choose this button to either view or edit the process specification(s) for
the product used in this profile.
Copy to clipboard – Choose this button to copy the profile data to the windows clipboard. You can then
paste the data to a different application.
Print – Choose this button to print a copy of the profile that is currently on your screen.
Green Check /Profile Explorer button– When finished viewing or analyzing the profile select this button
to either run another profile with this product or return to the KIC 2000 main menu. You will be returned
to the Profile Explorer if the profile was opened from there.
Figure 73: Graph Pointer