KIC 2000 v2.4.0.x
44 KIC 2000 User Manual
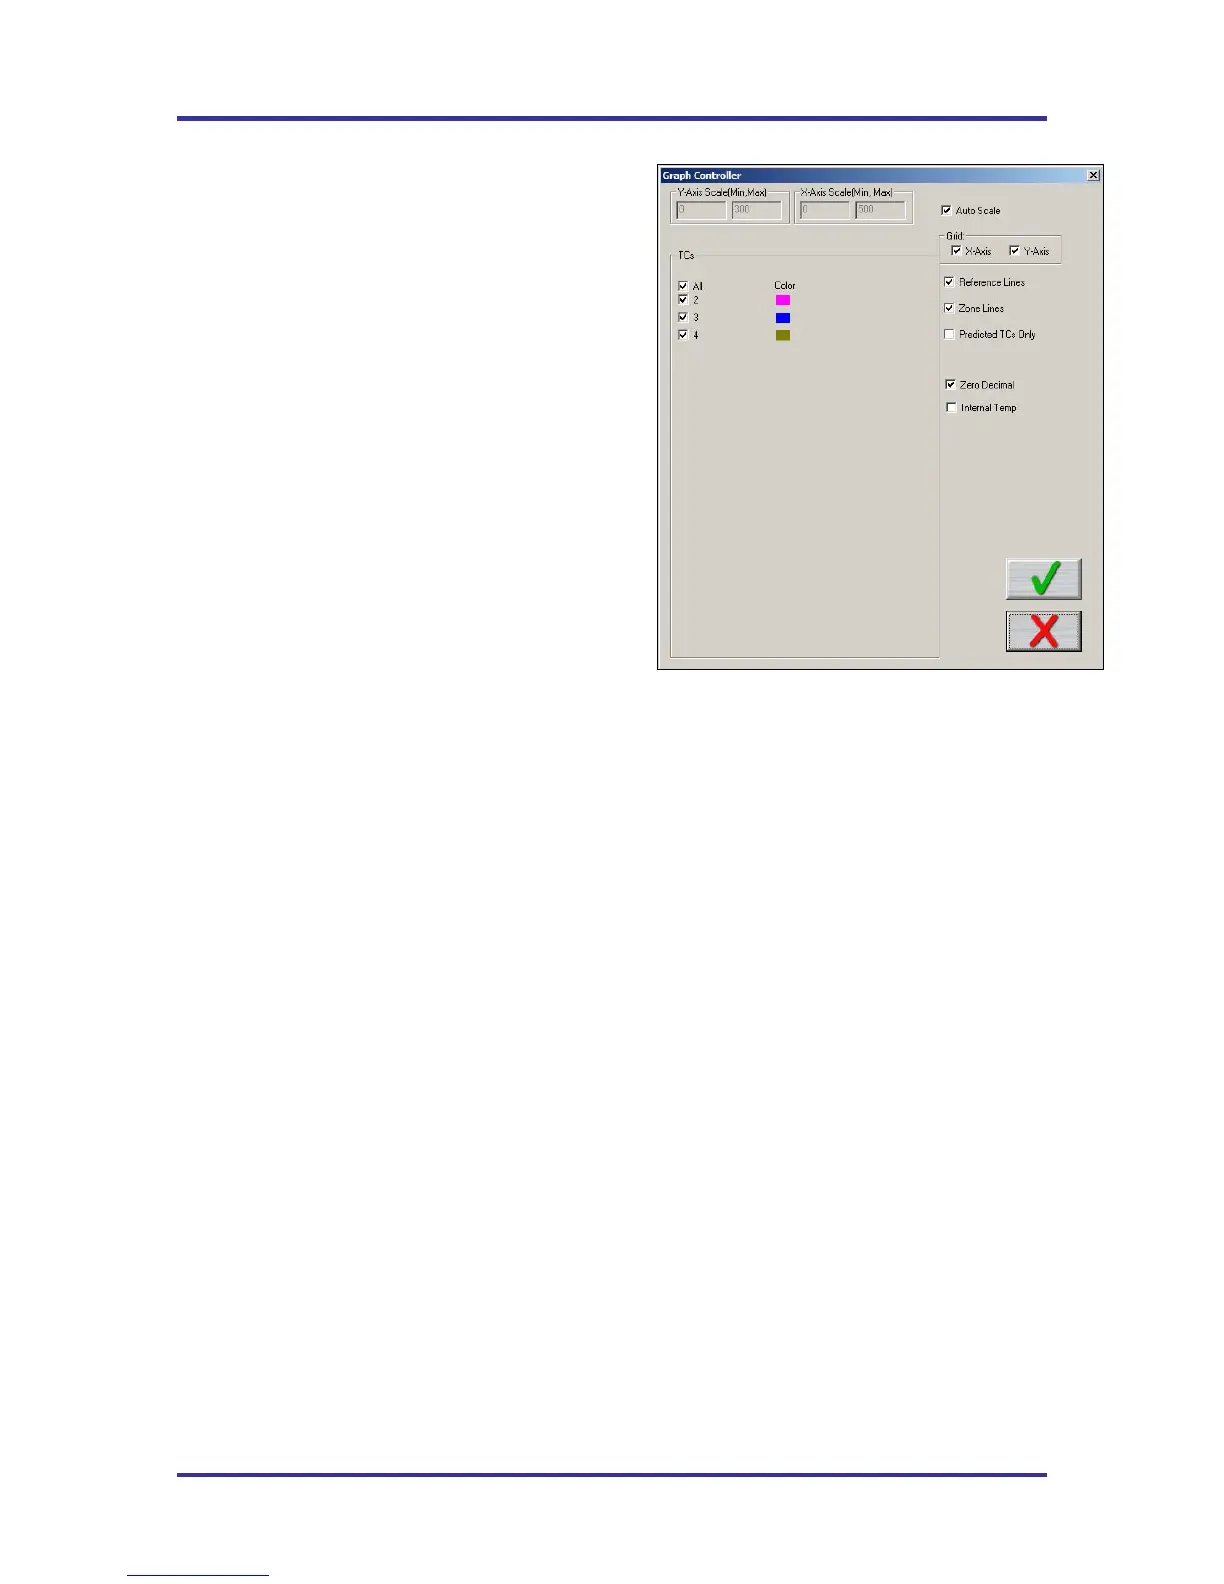
Graph Controller
The Graph Controller allows the user to modify the
view of the KIC 2000-profile graph. To open the Graph
Controller, Left-click on the TC column header in the
Statistics table or Double-Left –click, anywhere just
outside the profile graph.
Auto Scale – The Auto Scale feature will automatically
adjust the X, and Y axis scales to fit all of the data in the
profile graph. When the Auto Scale feature is disabled,
the user must manually input the minimum and
maximum scale settings for the X, and Y axis scale of
the profile graph.
Selecting Thermocouples to View
The TC’s section is a list of the thermocouples used for
the profile. By selecting All you are selecting that all the
thermocouples used for the original profile will be
displayed on the profile graph. In the event that you
wish to view the profile without a particular or multiple
thermocouples, you can deselect individual
thermocouples, or deselect the All check box, and
choose only the thermocouples you wish to view.
Deselecting Thermocouples
If a thermocouple has become disconnected during the profile, the profile results (PWI) may be affected to
due above normal peak temperatures and such. This situation may cause the profile PWI value to be
artificially inflated due to bad data. In the event a single or multiple thermocouples become disconnected
from the product during the profile, you can deselect the affected thermocouple(s). The KIC 2000 software
will recalculate the PWI, and update the profile statistics based on the remaining thermocouples selected.
You must select at least one product thermocouple.
Grid – Enables/disables the view of the X, and Y-Axis scales.
Reference Lines – Enables the view of Reference Lines displayed on the profile graph. These lines
represent any temperatures referenced in the selected Process Window.
Zone Lines – Enables the view for the oven zone lines on the profile graph.
Predicted TCs Only - Removes the Original profile plot form view, displaying only the prediction profile
plot on the graph.
Zero Decimal – When viewing the Pointer tool, this setting enables or disables the decimal display. When
unchecked, the software will display one decimal point.
Internal Temp – Enables the view of the KIC profiler’s internal temperature profile plot on the graph.
Figure 72: Graph Controller