KIC 2000 v2.4.0.x
KIC 2000 User Manual 43
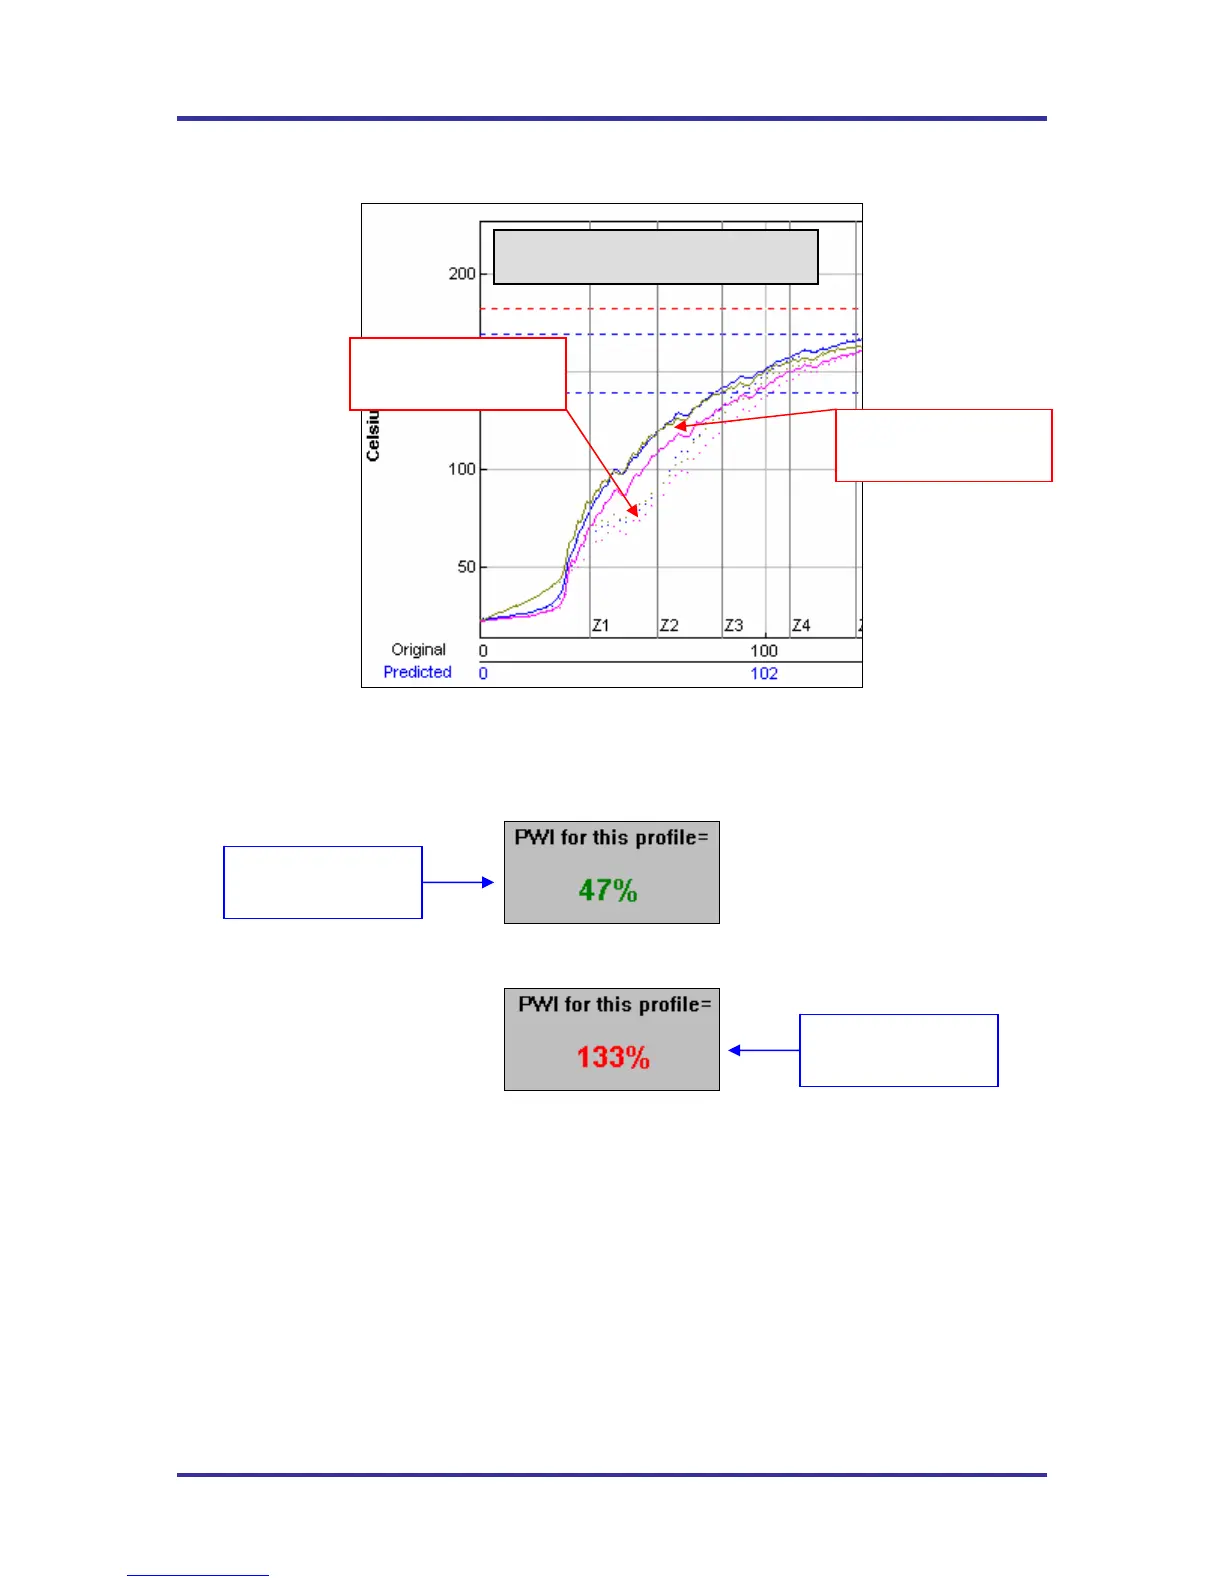
Profile Graph Display
Figure 69: Graph Display
The PWI for the profile is displayed in the bottom-Left corner of this screen. If the measured PWI is below
100%, the value will be displayed in a Green font. See Figure 70. If the measured PWI is 100% or higher,
the value will be displayed in a Red font. See Figure 71.
Figure 70: PWI In-Spec
Figure 71: PWI Out-of-Spec
This display method enables the user to easily identify if the profile is in or out of spec.
Original profile plot
(solid lines)
Predicted profile plot
(dotted lines)
Profile Graph
A PWI under 100%
is acceptable
A PWI above 100%
is unacceptable