LAUNCH X-431 PRO3 User Manual
43
page/total page number. Swipe the screen from the right/left to advance/return to the
next/previous page.
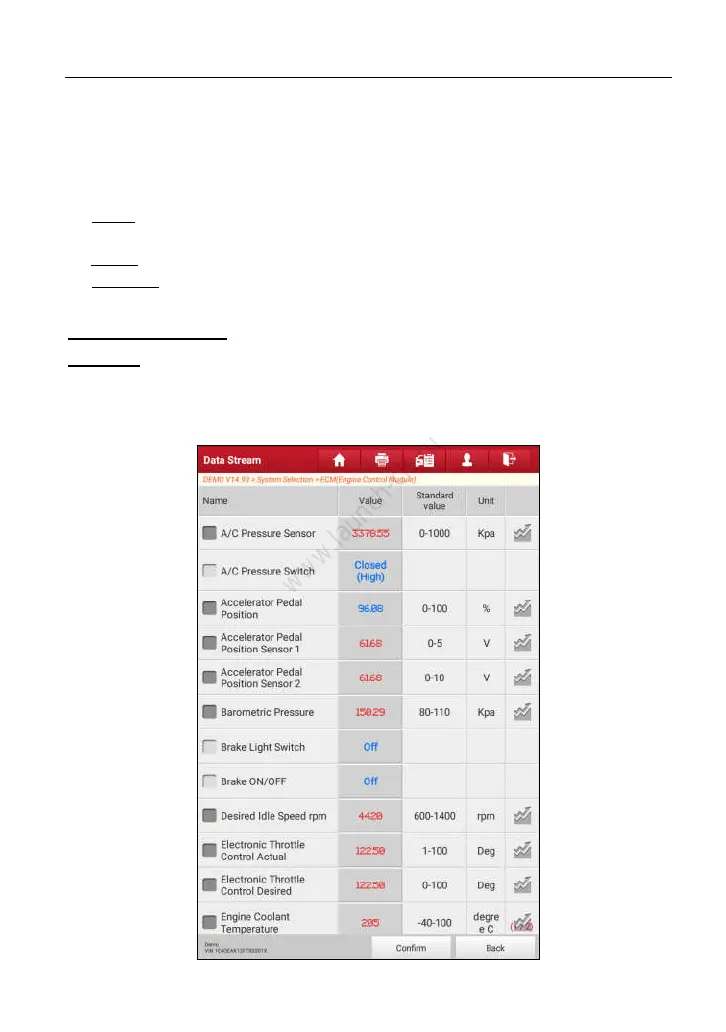
There are 3 types of display modes available for data viewing, allowing you to
view various types of parameters in the most suitable way.
Value – this is the default mode which displays the parameters in texts and
shows in list format.
Graph – displays the parameters in waveform graphs.
Combine – this option is mostly used in graph merge status for data
comparison. In this case, different items are marked in different colors.
On-screen Buttons:
Combine
: This option is mostly used in graph merge status for data comparison.
In this case, different items are marked in different colors. Tap it to select the
desired items (maximum 4 items can be selected), and then tap “Confirm” to
view the merged items in graph. See Fig. 5-30 & Fig. 5-31.