Maxim Integrated Page 34 of 42
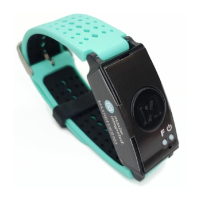
Figure 42. IR and Red signals displayed during SpO
2
measurement.
After a brief period, the measurement is complete and the SpO
2
measurement is
displayed.
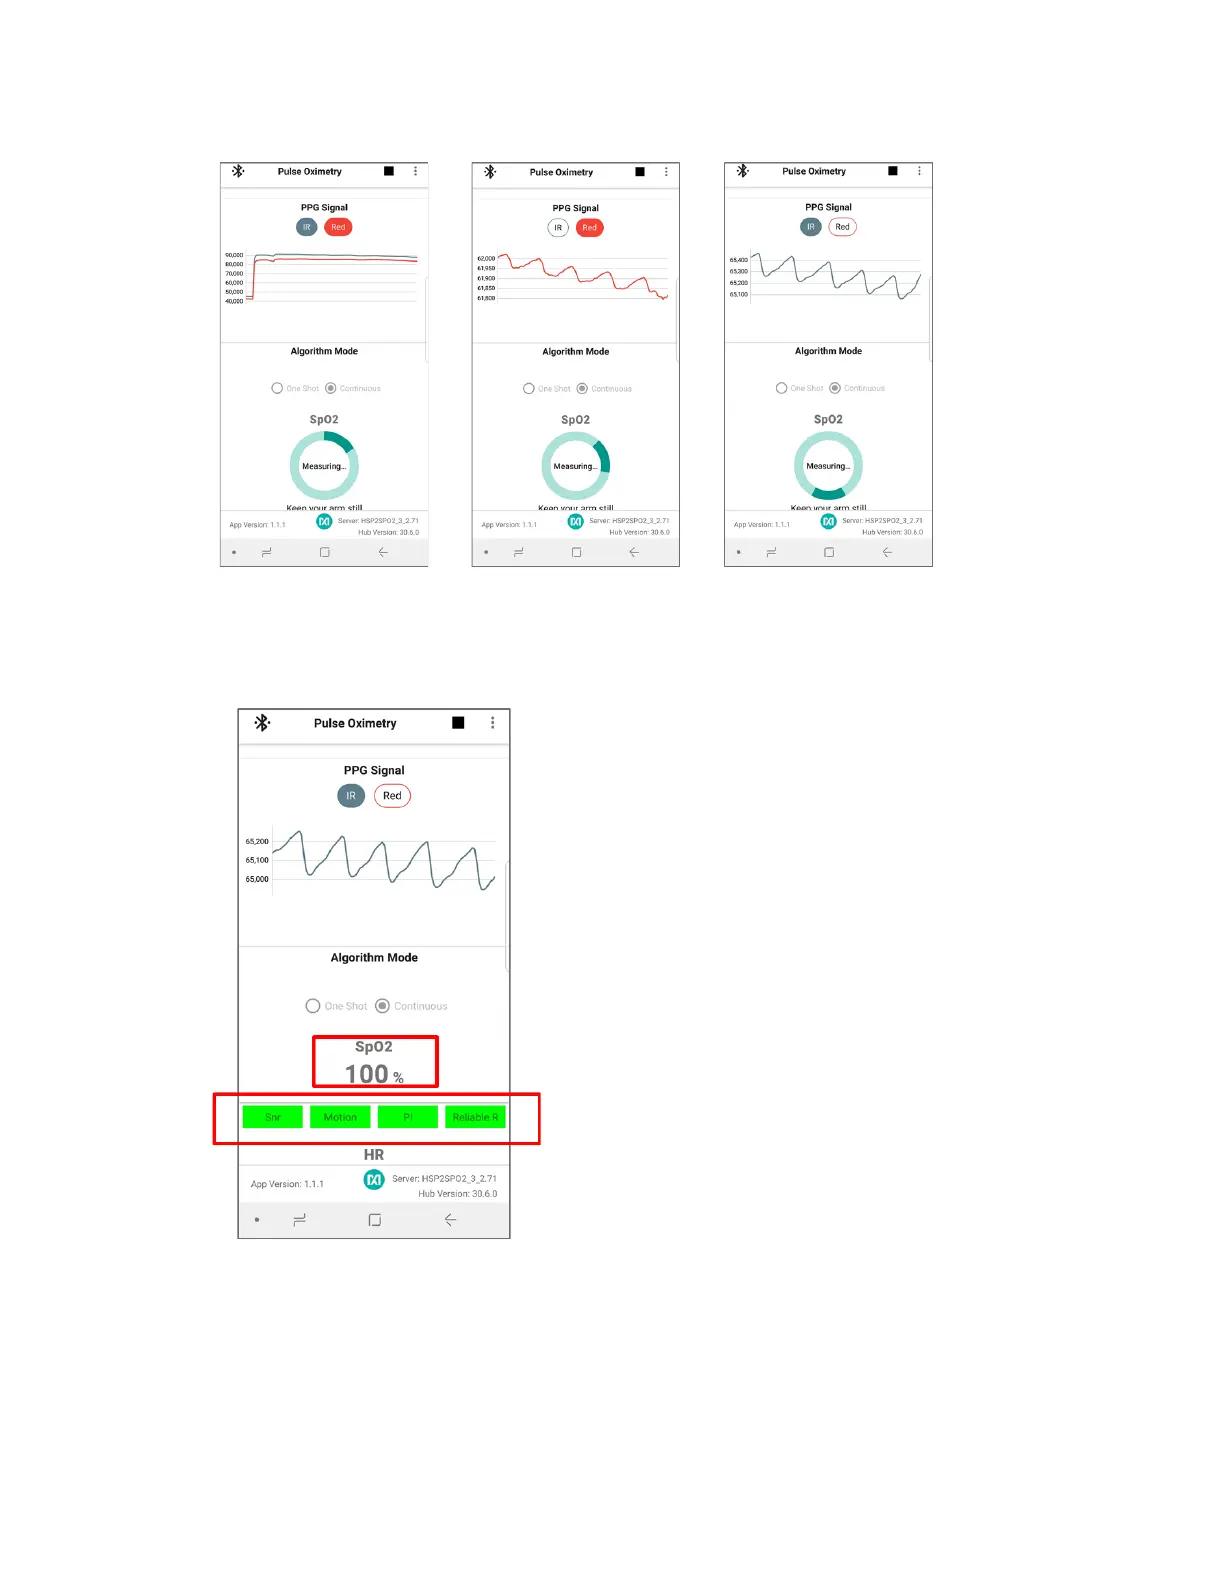
Figure 43. SpO
2
measurement.
4. Feedback on the signal quality is displayed by the color of the Snr, Motion, Pi, and Reliable
R indicators. These indicators turn red during the following conditions:
• Snr indicates that the signal has a low signal-to-noise ratio.
• Motion indicates that movement on the health sensor band is excessive and wrist
movement should be minimized in order to retrieve proper SpO
2
reading.