23 | Preparation for use / operating instructions
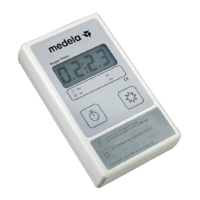
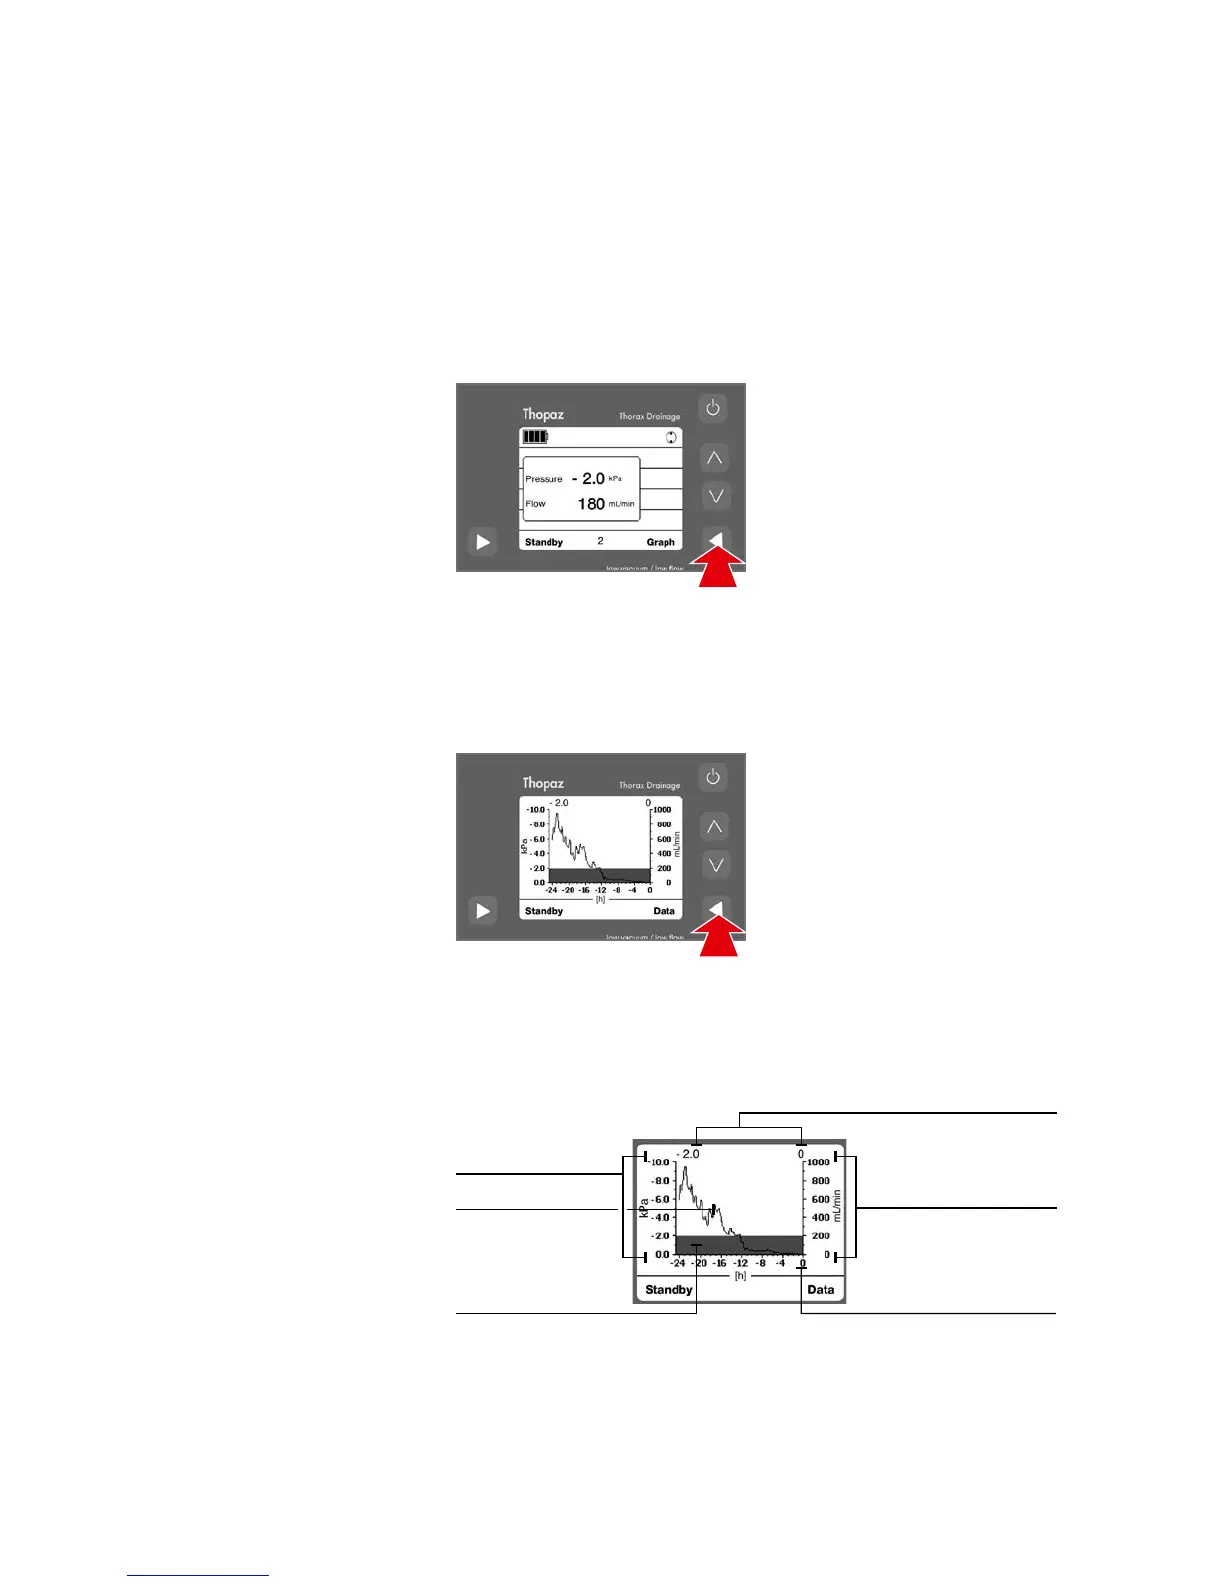
Data mode
– Flow values between 0 and 1000 mL / min = 10 mL steps.
– Flow values over 1000 mL / min = 100 mL steps.
– Lowest displayed flow value in data mode = 10 mL / min.
The set pressure value and
the current flow value (equiva-
lent to parenchymal leakage)
are digitally displayed.
Graph mode The Graph mode shows the
flow and pressure progression
as a function of time. The
graph is updated every
10 minutes. 4 hours are
necessary to have a
representative graph.
After 60 seconds, the display
switches back to the data
mode.
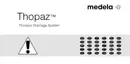
The current flow and pressure values are indicated in the
information field.
– The left scale shows the pressure in the desired unit
(max. -10 kPa). The pressure is represented by a filled area.
– The right scale shows the flow in the desired unit
(max. 1000 mL). The flow values are shown as a line.
Flow scale
Pressure scale
Flow
Pressure
Current pressure and flow values
Current time
Check therapy progress
Two different modes are available. Toggle between the two modes by pressing «Data»
or «Graph»:
8.6
graphic presentation
Operation