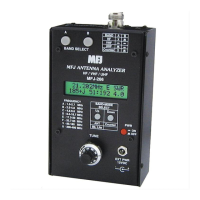
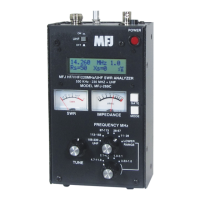
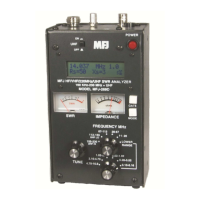
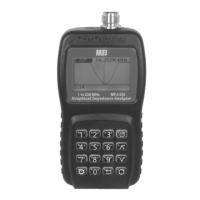
MFJ-226 Graphical Antenna Impedance Analyzer
12 Version 1A 1R02
R
14.250000 MHZ
R= 53.20
X = -8.02
SWEPT DATA SCREENS
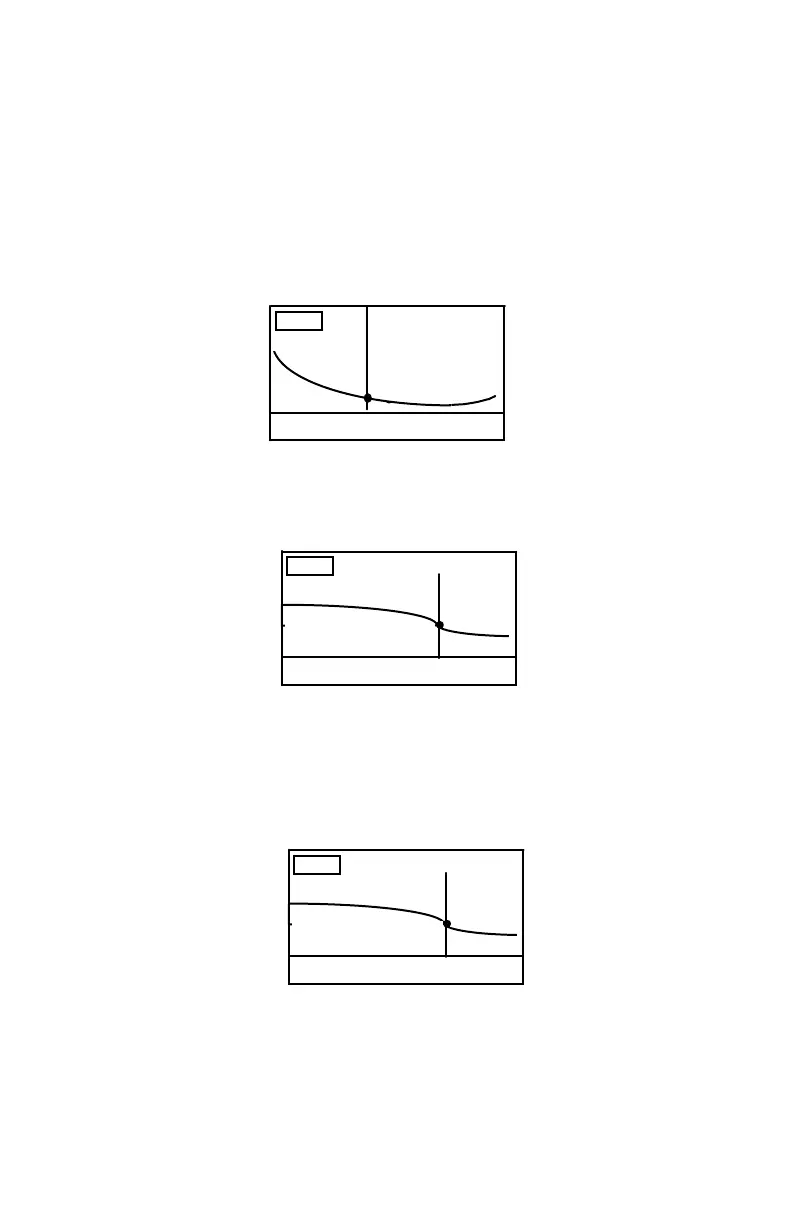
SWR Screen: Each swept plot is identified in the upper left-hand
corner, and the tunable marker frequency appears to the right. Use
the Up/Down Arrow keys to step or scroll across the display's
frequency range. The numerical test data corresponding to the
marker location appears in the data window below (Ex. SWR is 1.24:1
at the marker).
SWR
14.100000 MHZ
1.24
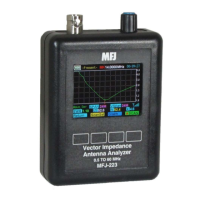
Impedance Magnitude Screen (Z): This plot displays changes in
Impedance Magnitude (Z) across the plot's frequency span.
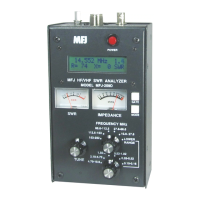
Resistance Screen (R): The Resistance plot shows shifts in the
load's resistive component as a function of frequency. Note that a
corresponding reactance value and sign also appear.
Z
14.250000 MHZ
Z= 53.20


 To Next Page