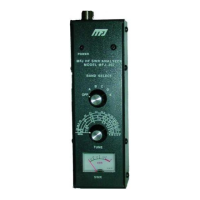
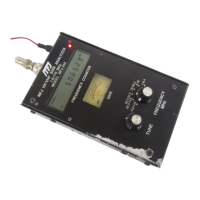
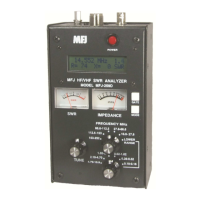
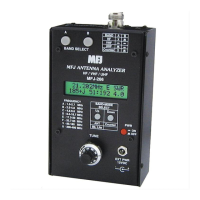
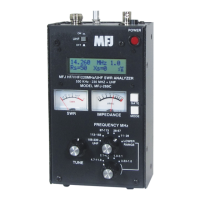
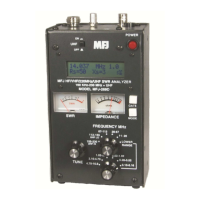
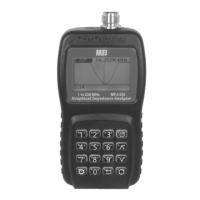
MFJ-226 Graphical Antenna Impedance Analyzer
13 Version 1A 1R02
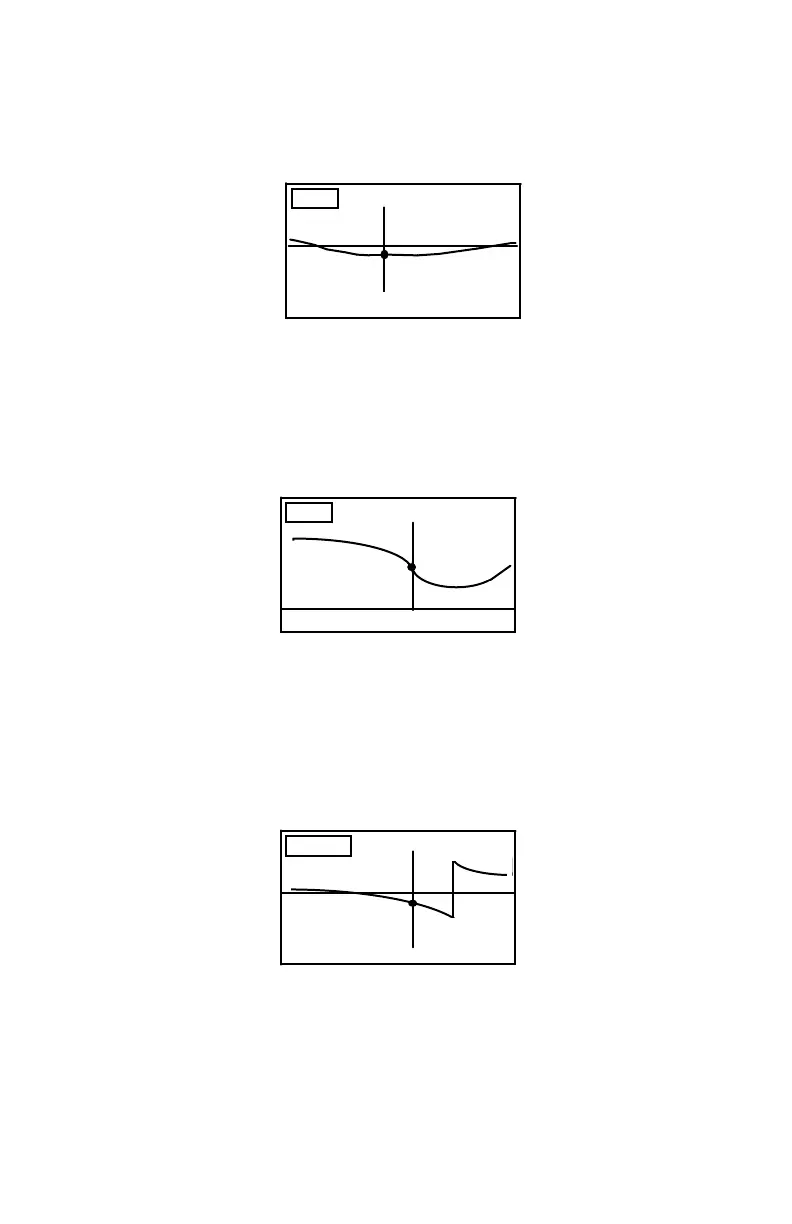
X
14.250000 MHZ
R = 53.20 X = - 5.32
Reactance Screen (+X or -X): The Reactance plot tracks both
reactive value and displays sign to accurately identify if the load is
capacitive or inductive. The resistive component is also shown.
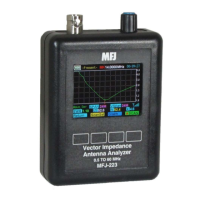
Return Loss (S11): The RL Plot shows the ratio of reflected power to
forward power expressed in dB across the frequency span. The
higher the return loss ratio, the lower the load's SWR.
RL
14.250000 MHZ
14.87 DB -55 DEG
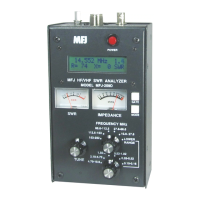
Phase Angle (Deg): When a test signal (incident wave) is transmitted
to the load under test, the returning signal (reflected wave) will rarely
return in phase. This screen plots the phase angle and amplitude
ratio between the incident and reflected wave.
PHASE
14.250000 MHZ
14.87 DB -55 DEG


 To Next Page