8-2 8 Test and Maintenance Software
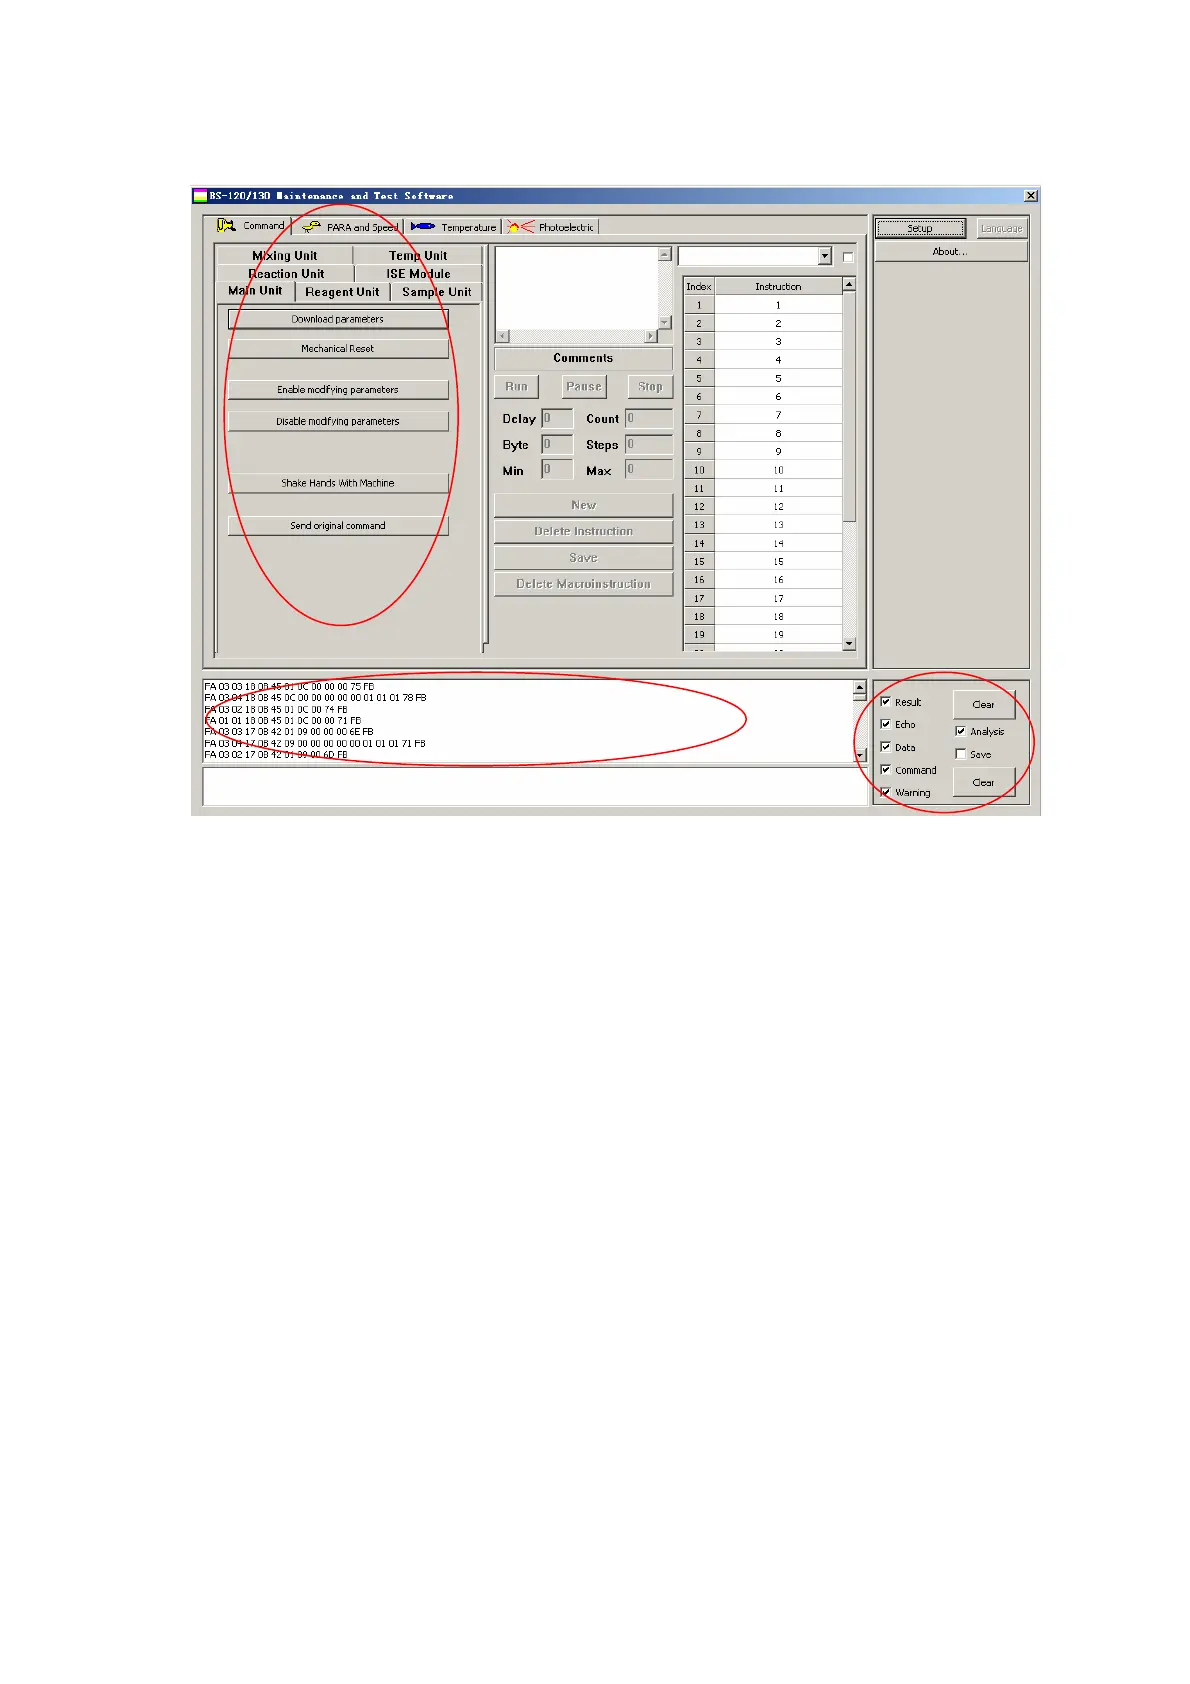
Figure 8-1 Screen layout of Test and Maintenance Software
The upper area provides various function buttons to test each unit.
The lower area displays the communication data associated with the main unit/subunits.
The lower-right area provides options and buttons to control the communication frame.
8.1.2.2 Function Distribution
Click Command on the higher-left area as shown in Figure 8-2. At the Command screen,
you can select different units and then you can see the debugging buttons of the
corresponding units.
Similarly, you can choose PARA and Speed, Temperature, Photoelectric on the
higher-left area to run different debugging functions.The following is an introduction of the
Command, PARA and Speed, Temperature, Photoelectric.
The function buttons for serial port setup, version query are located on the higher-right
area of the main interface.
 Loading...