10 Calculation Methods
10-4
complicated at the beginning and there are miscellaneous reactions due to the complex
serum compositions.
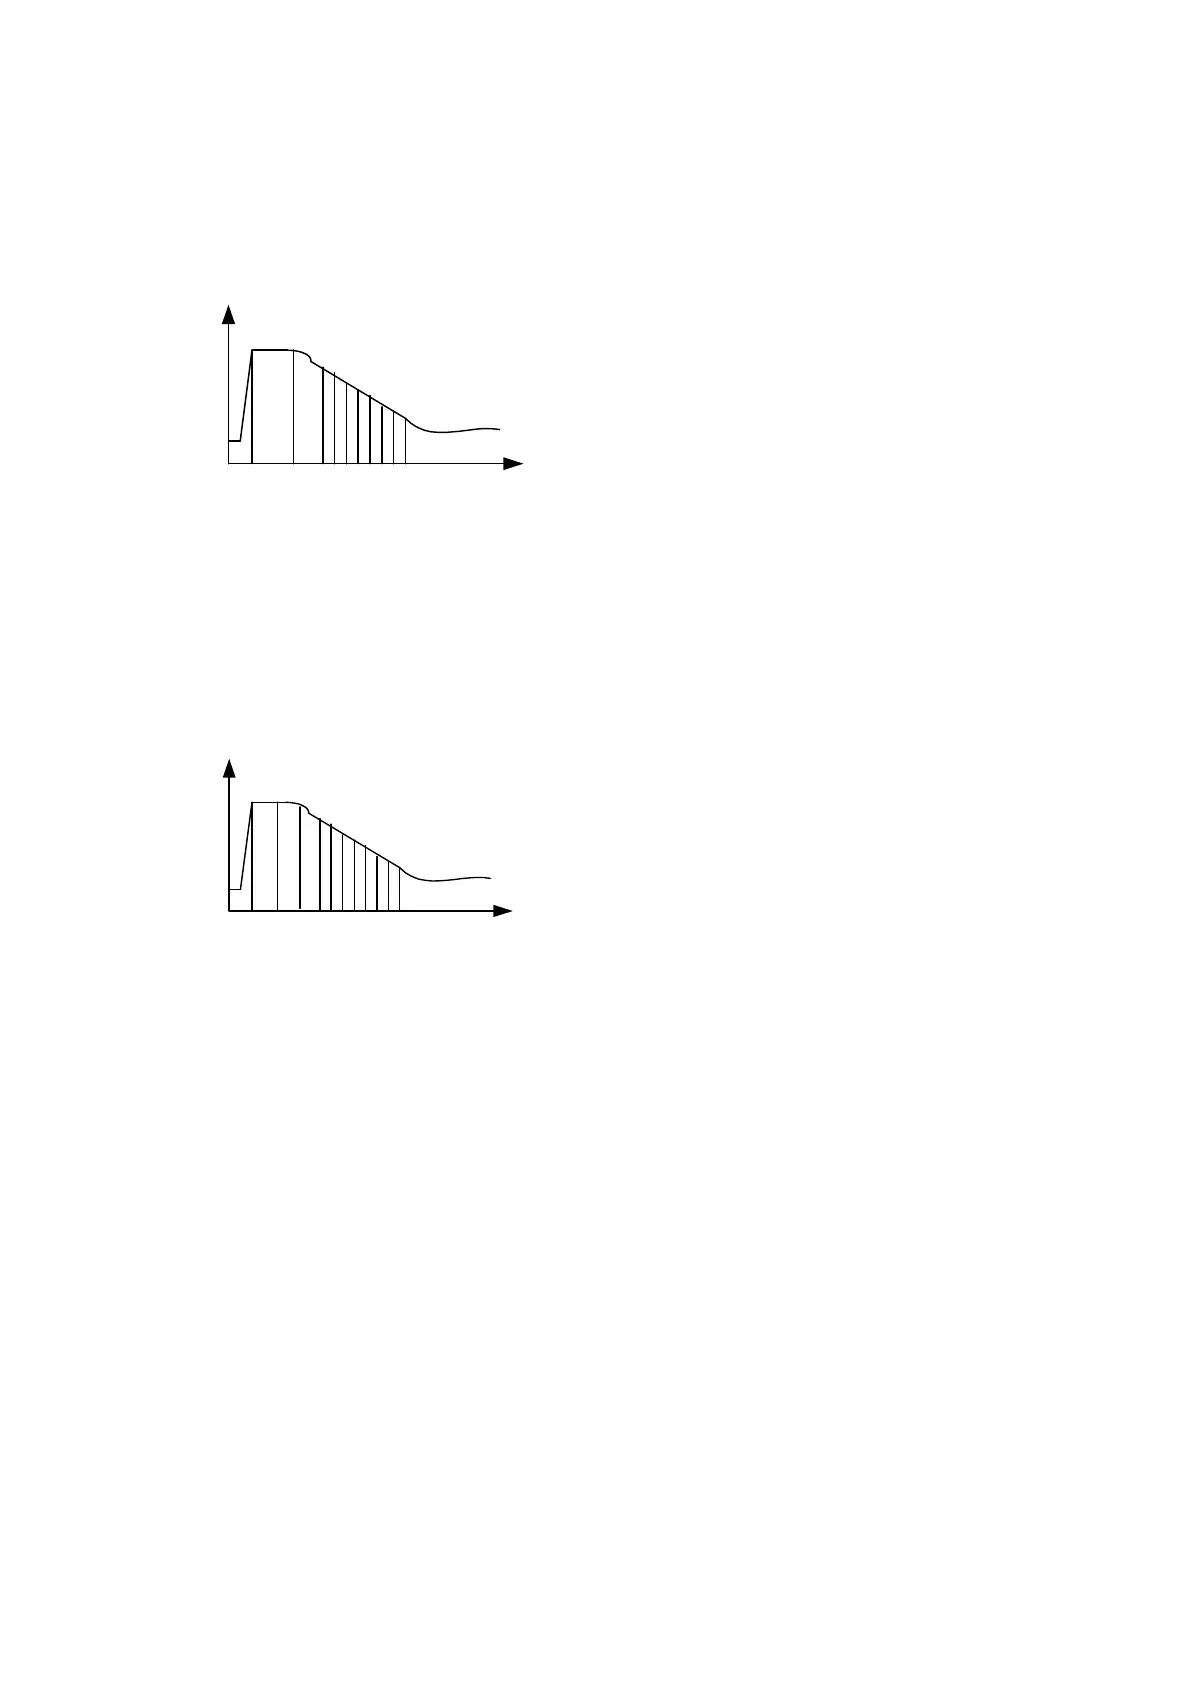
Figure 10-5 Single-reagent Kinetic Reaction Curve
A
t
t1 t2 t3 tn
As shown in Figure 10-5,
1
t is the time when the reagent is added,
2
t is the time when
the sample is added and the reaction starts when they are mixed. From
3
t
the reaction
becomes steady.
n
t
is the time to stop monitoring the reaction.
2
t to
3
t
is the delay
period, and
3
t
to
n
t
is the monitoring period, during which the absorbance readings are
taken.
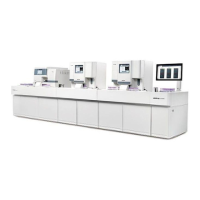
Figure 10-6 Double-reagent Kinetic Reaction Curve
A
t
t1 t2 t4 tn
t3
As shown inFigure 10-6,
1
t is the time when the first reagent is added, and
2
t is the
time when the sample is added, and then they are mixed.
3
t
is the time when the second
reagent is added, then the reaction starts when they are mixed. At
4
t the reaction reaches
equilibrium, and
n
t
is the time to stop monitoring the reaction.
3
t
to
4
t is the delay
period, and
4
t to
n
t
is the monitoring period, during which the absorbance readings are
taken.
10.2 Calculation Process
The system adopts such a measurement and calculation flow as shown in Figure 10-7.