PC SOFTWARE – MONI LOG® ANALYZER EnDaL smart
- 22 -
4 . 2 . 4 V i e w o f t h e m e a s u r e m e n t d a t a
Graphs
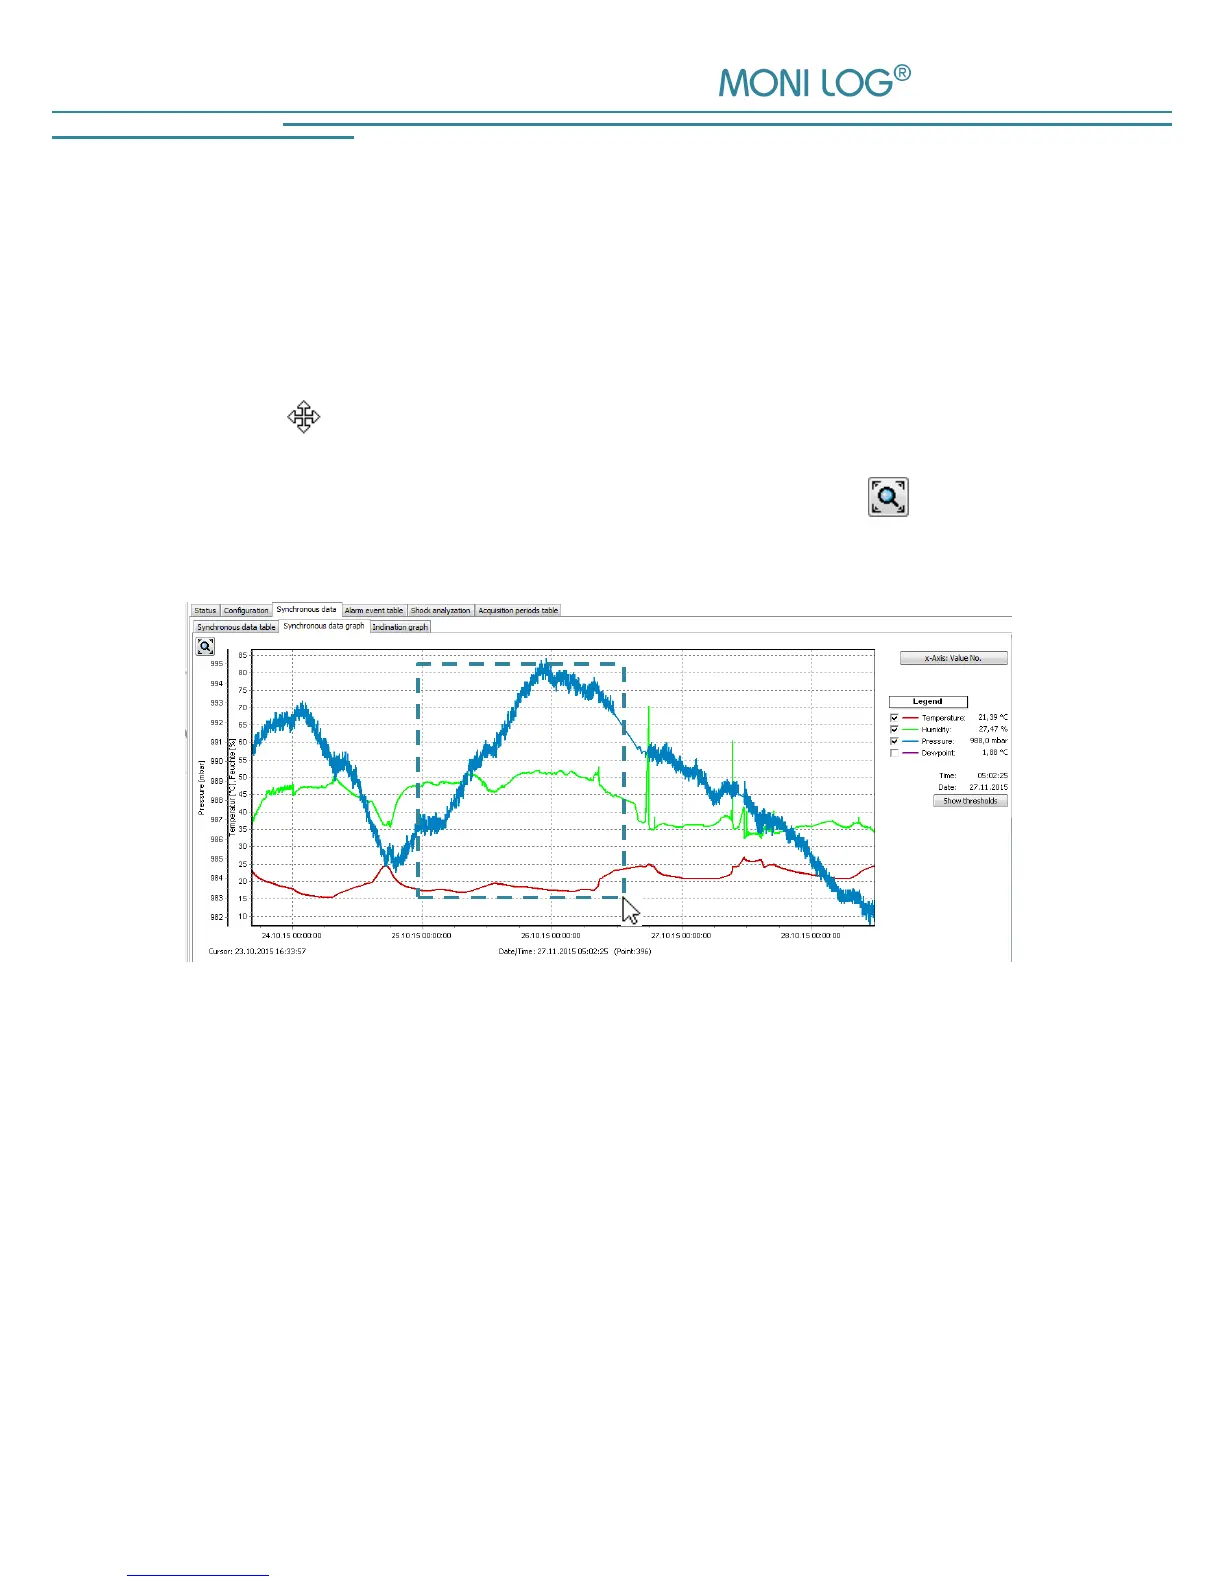
In a graph it is possible to zoom in. For this purpose, draw up a selection window using the
mouse (see Figure 7). The view of linear represented graphs can be shifted using the held right
mouse button . Logarithmically represented graphs can be zoomed at the desired place, but
cannot be moved. By moving the mouse wheel up/down, concentric zooming is carried out. The
standard zoom is restored by double-clicking on the graph, or using the button .
Figure 7: Zoom-selection window