EnDaL smart PC SOFTWARE – MONI LOG® ANALYZER
- 35 -
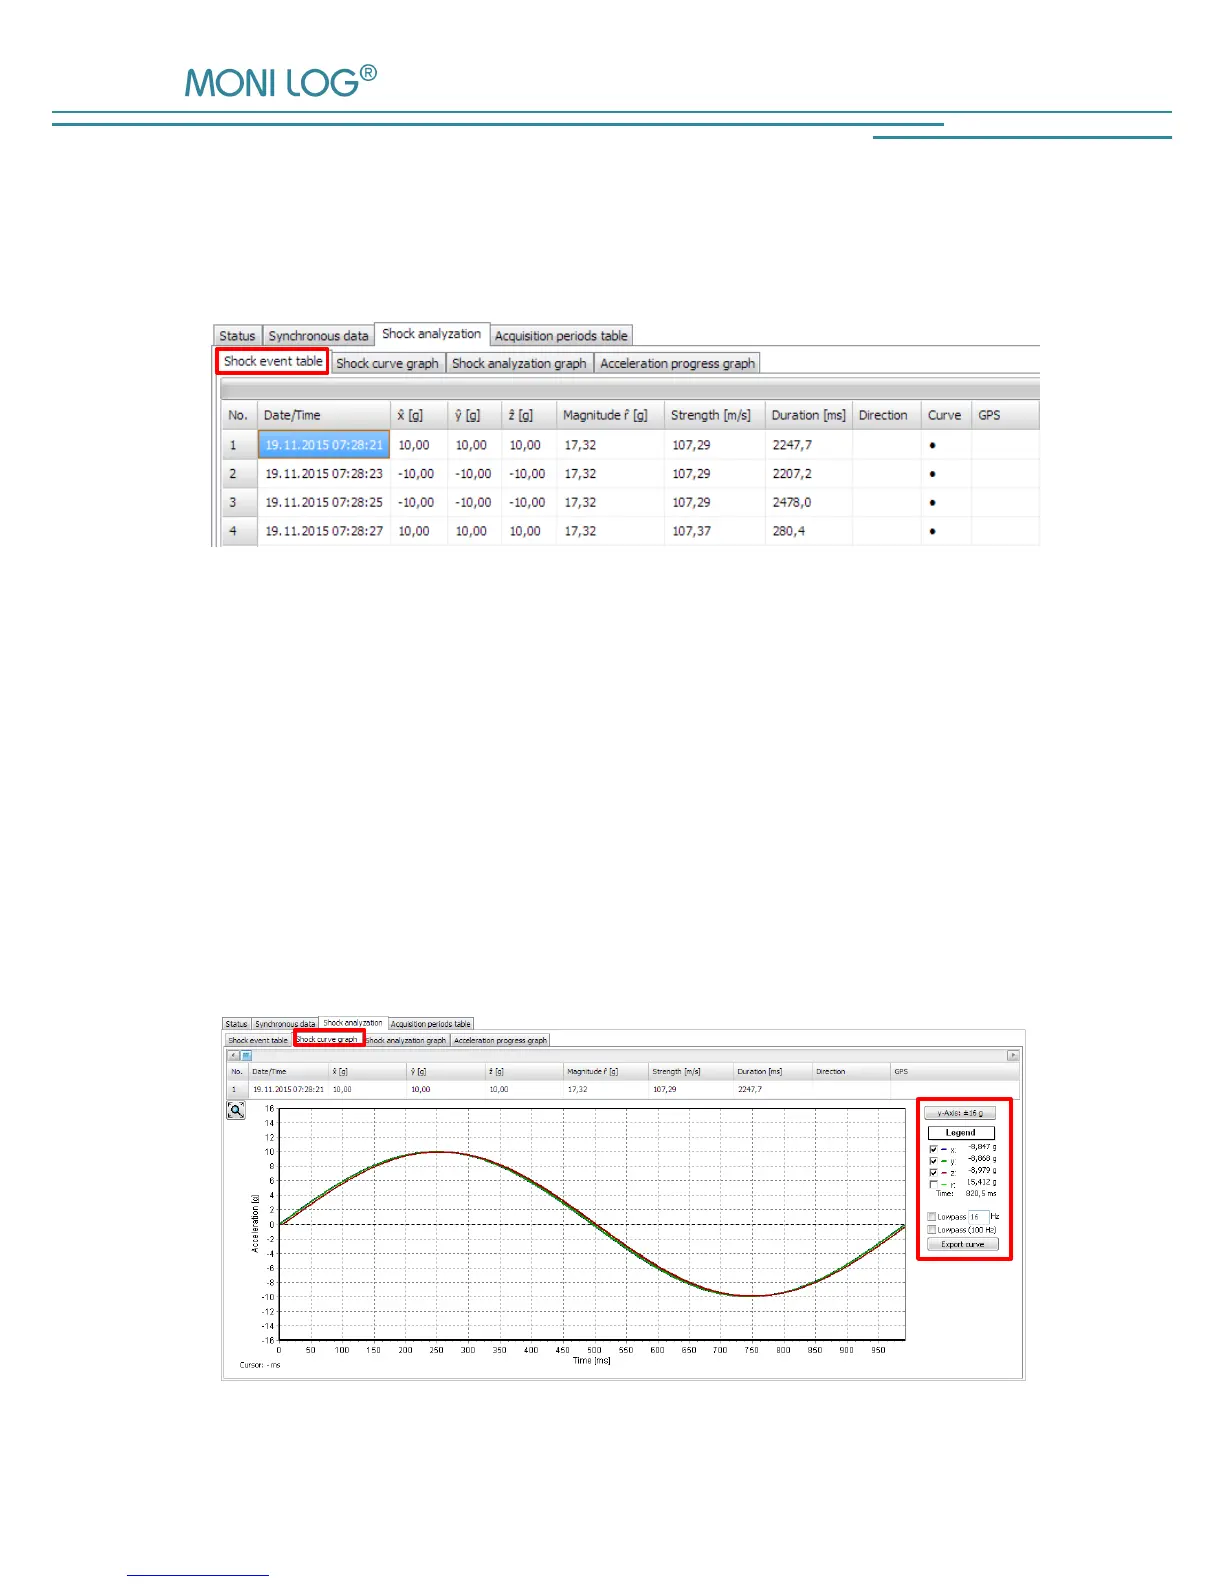
4 . 3 . 9 S h o c k e v e n t s a n d s h o c k c u r v e s
All shock events are set out in tabular form under the programme tab “Shock events“. By a double
click on the table row, the corresponding curve can be accessed.
Figure 21: Shock event table
In the programme tab “Shock curves graph” the recorded shock curves are shown as a graph. By
activating or deactivating the “check marks” in the legend on the right side, the x,y,z-
the magnitude curve can be shown or hidden respectively (see
Figure 22)
In addition, by activating the low-pass filter function and input of the critical frequency, the
unwanted high frequency portions can be filtered out from the view. This is a view option and it
does not change the original data.
By means of the button “Display range: ± 16 g”, the vertical graph axis is switched between the
limits of the curve and ± 16 g.