44
Digitax SF Instruction Manual
7. Tuning
4
4. Using Digitax SF Connect to Measure Vibration Frequency (FFT)
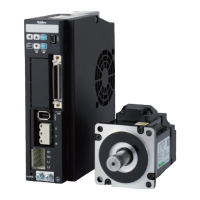
Load the waveforms measured or waveform
data saved to display�
(The example shown on the right is saved waveform data�)
Select a parameter of which the vibration
frequency is to be investigated�
Mark the check box to display the waveform�
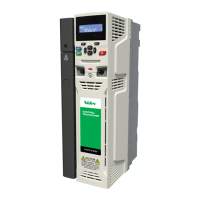
Select
Position Command Filter
or
Torque Command Filter
Select a range to investigate vibration frequency�
If the position command lter or torque command lter is
selected, the second cursor location of the chart will be
determined based on the 1st cursor location such that
the display range will contain 2
nd
sample points�
Click
Frequency display
�
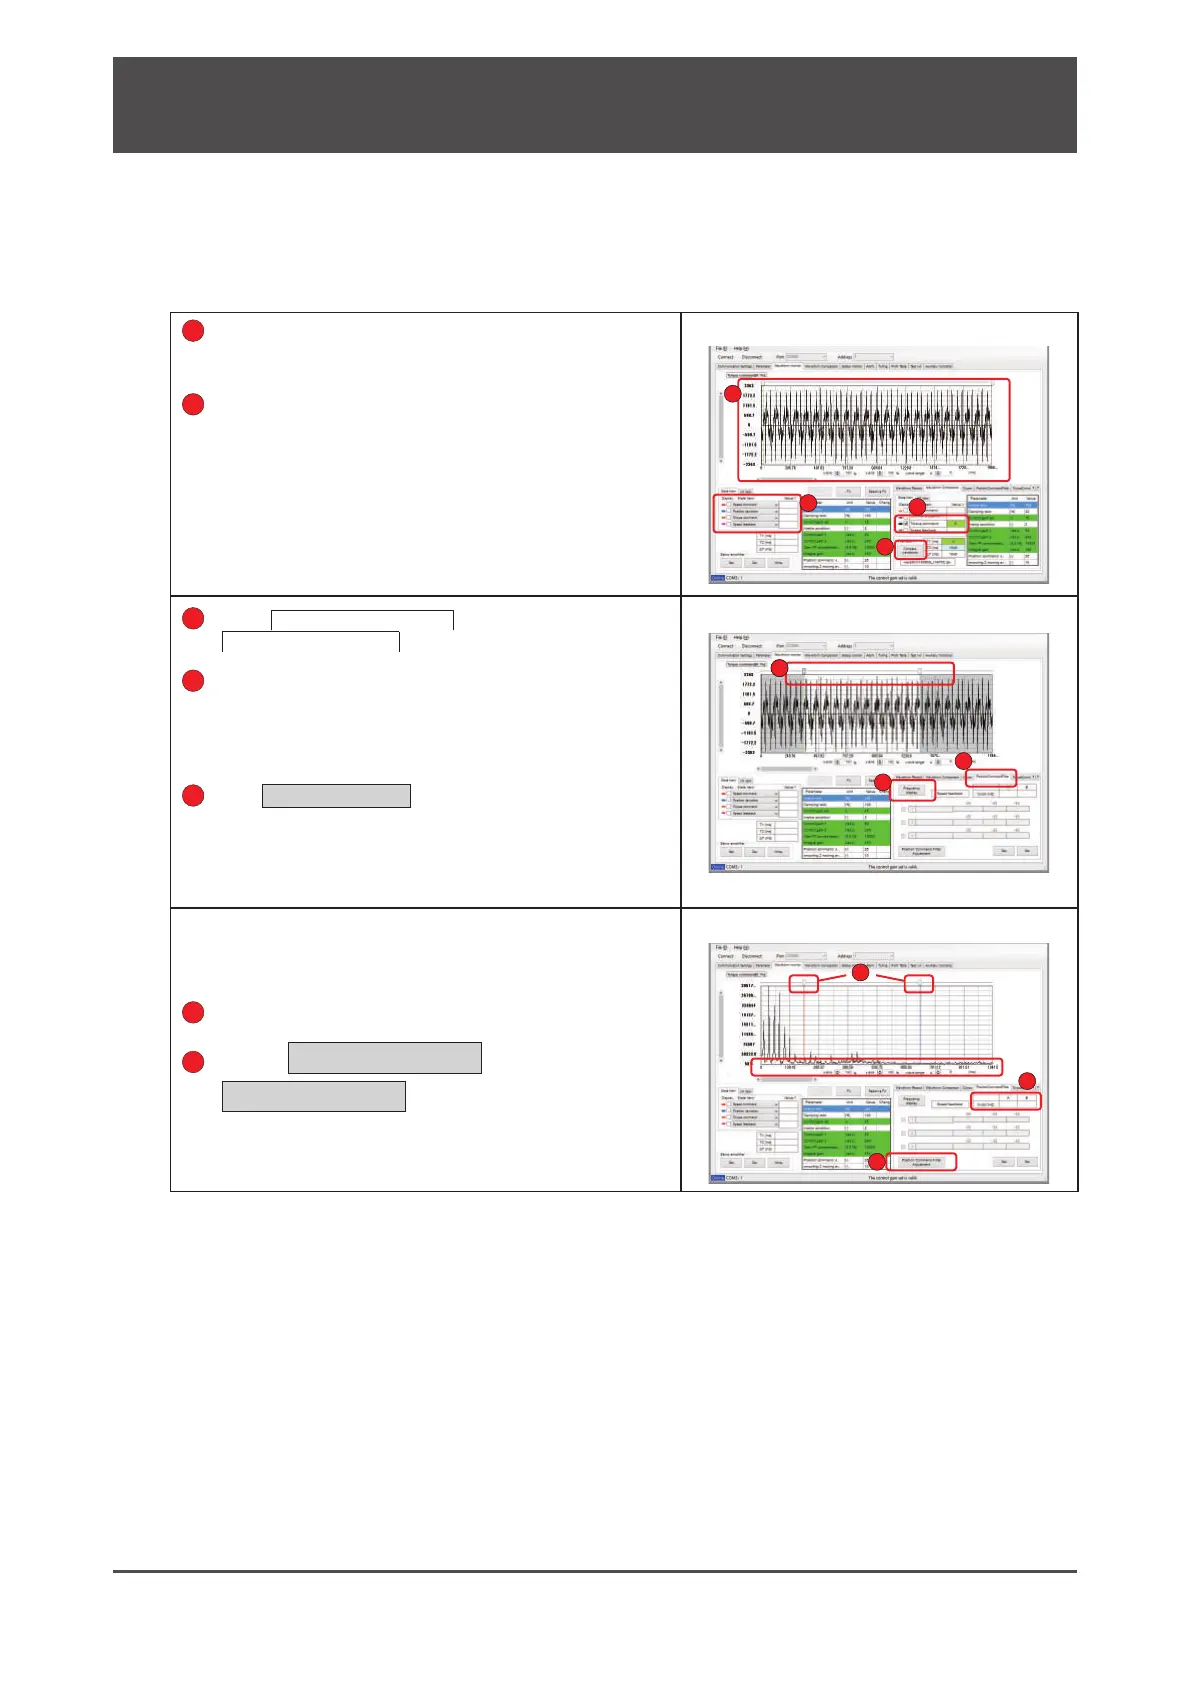
The x-axis unit will be changed from time [ms] to frequency
[Hz]� The display unit of the graph in the range between the
1st and 2nd cursors will be converted to frequency�
When the x-axis unit on the graph is switched to frequency, the
cursor colors will change�
The table will show the frequency in red on column A and blue on
column B�
Read the peak value by using the cursor�
Click on
Position Command Filter
Adjustment
or
Torque Command Filter
Adjustment
)
This will take you to the filter setup window under the tuning
tab where a filter can be set�
1
1
2
2
44
3
5
6
6
7