12 Measuring Procedure
36 / 92 Instruction Manual Myopia Master® (G/68100/EN Rev04 0820)
critical; repeat the measurement, if necessary.
If the field has a red background (
6) - repeat the measurement.
Camera image (4)
The cornea or the edge of the iris is marked in the camera image.
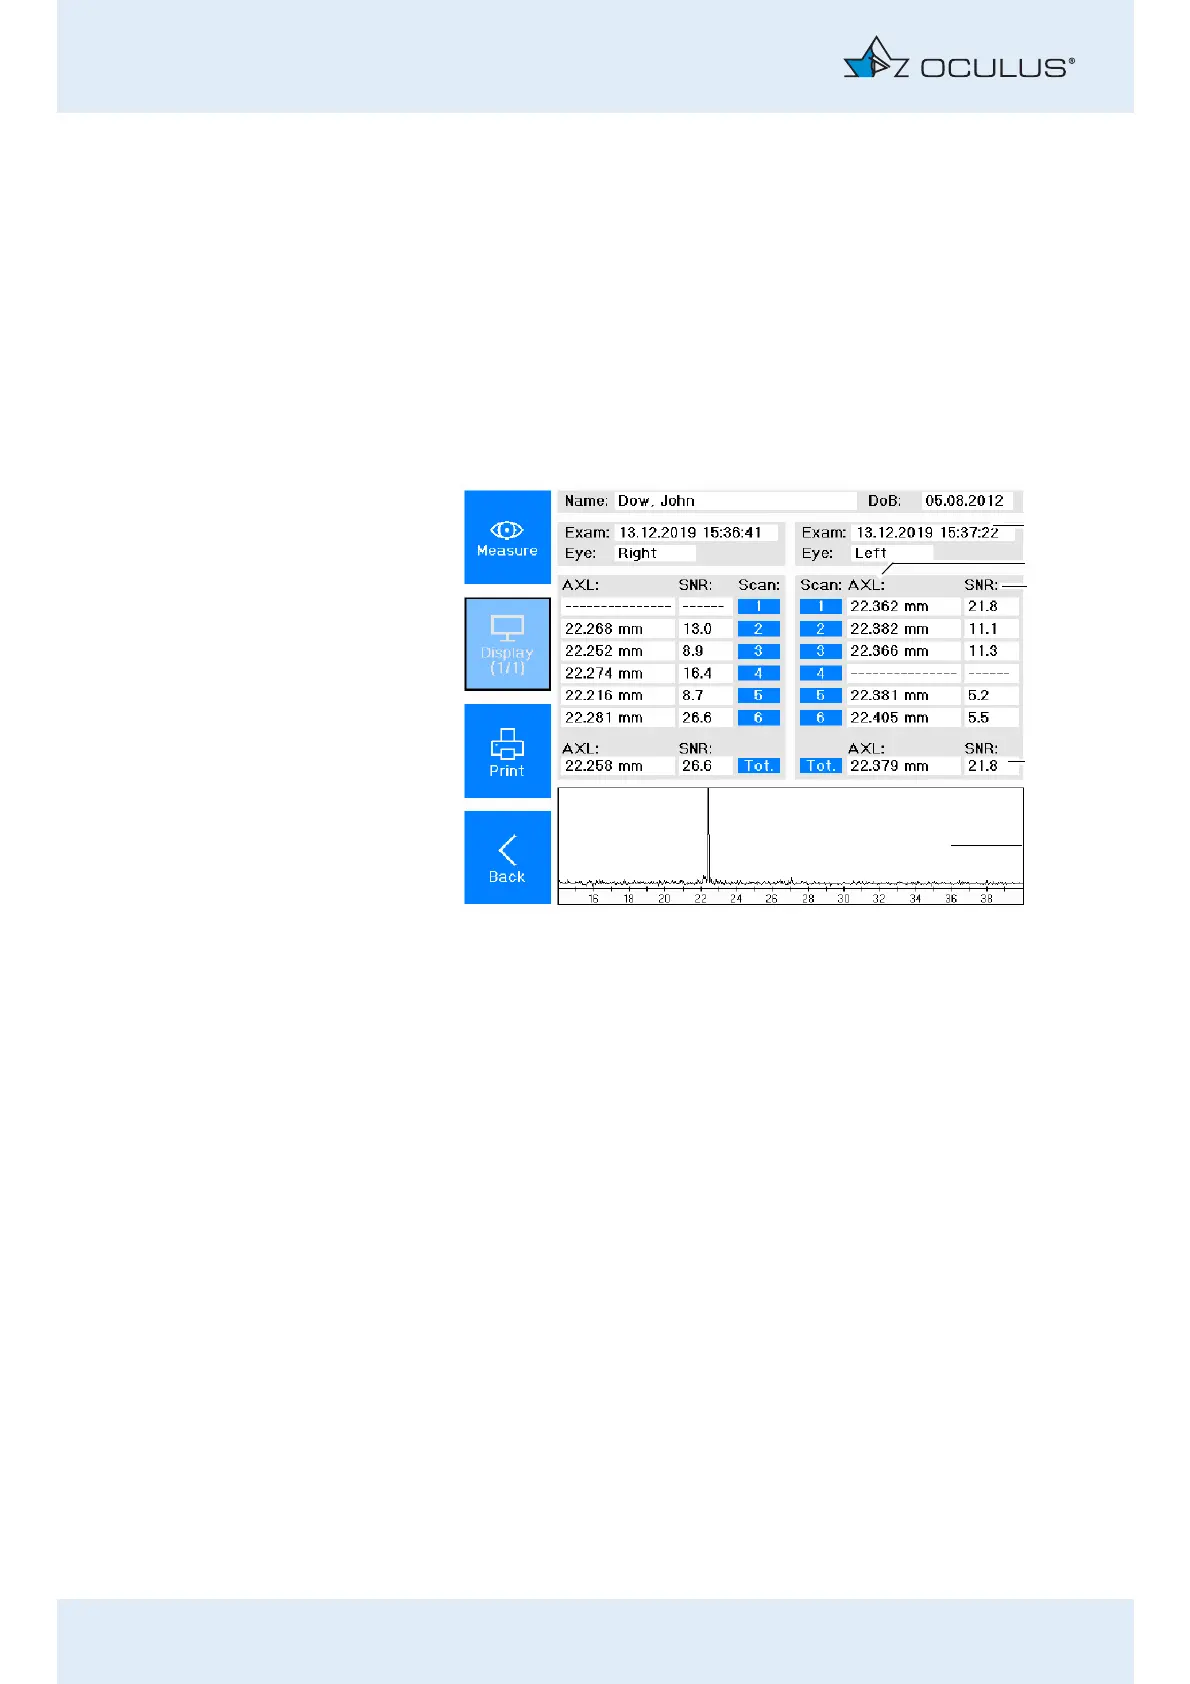
12.3.4 Axial length results
After performing the measurement the following display appears.
The axial length values for one or both eyes are shown in the table (2).
The corresponding signal to noise ration (SNR) (3) is listed. The axial
length with the highest SNR (4) is shown in a single line.
Furthermore the SNR is shown in a graph (5).
12.3.5 Ending the measurements
Print and/or save the data, sec. 12.8, page 44.
1 Patient and examination data 4 Highest SNR value
2 AXL values 5 Signal to noise ratio graph
3 SNR values
Fig. 12-9: AXL overview display