ML182/183
----------------
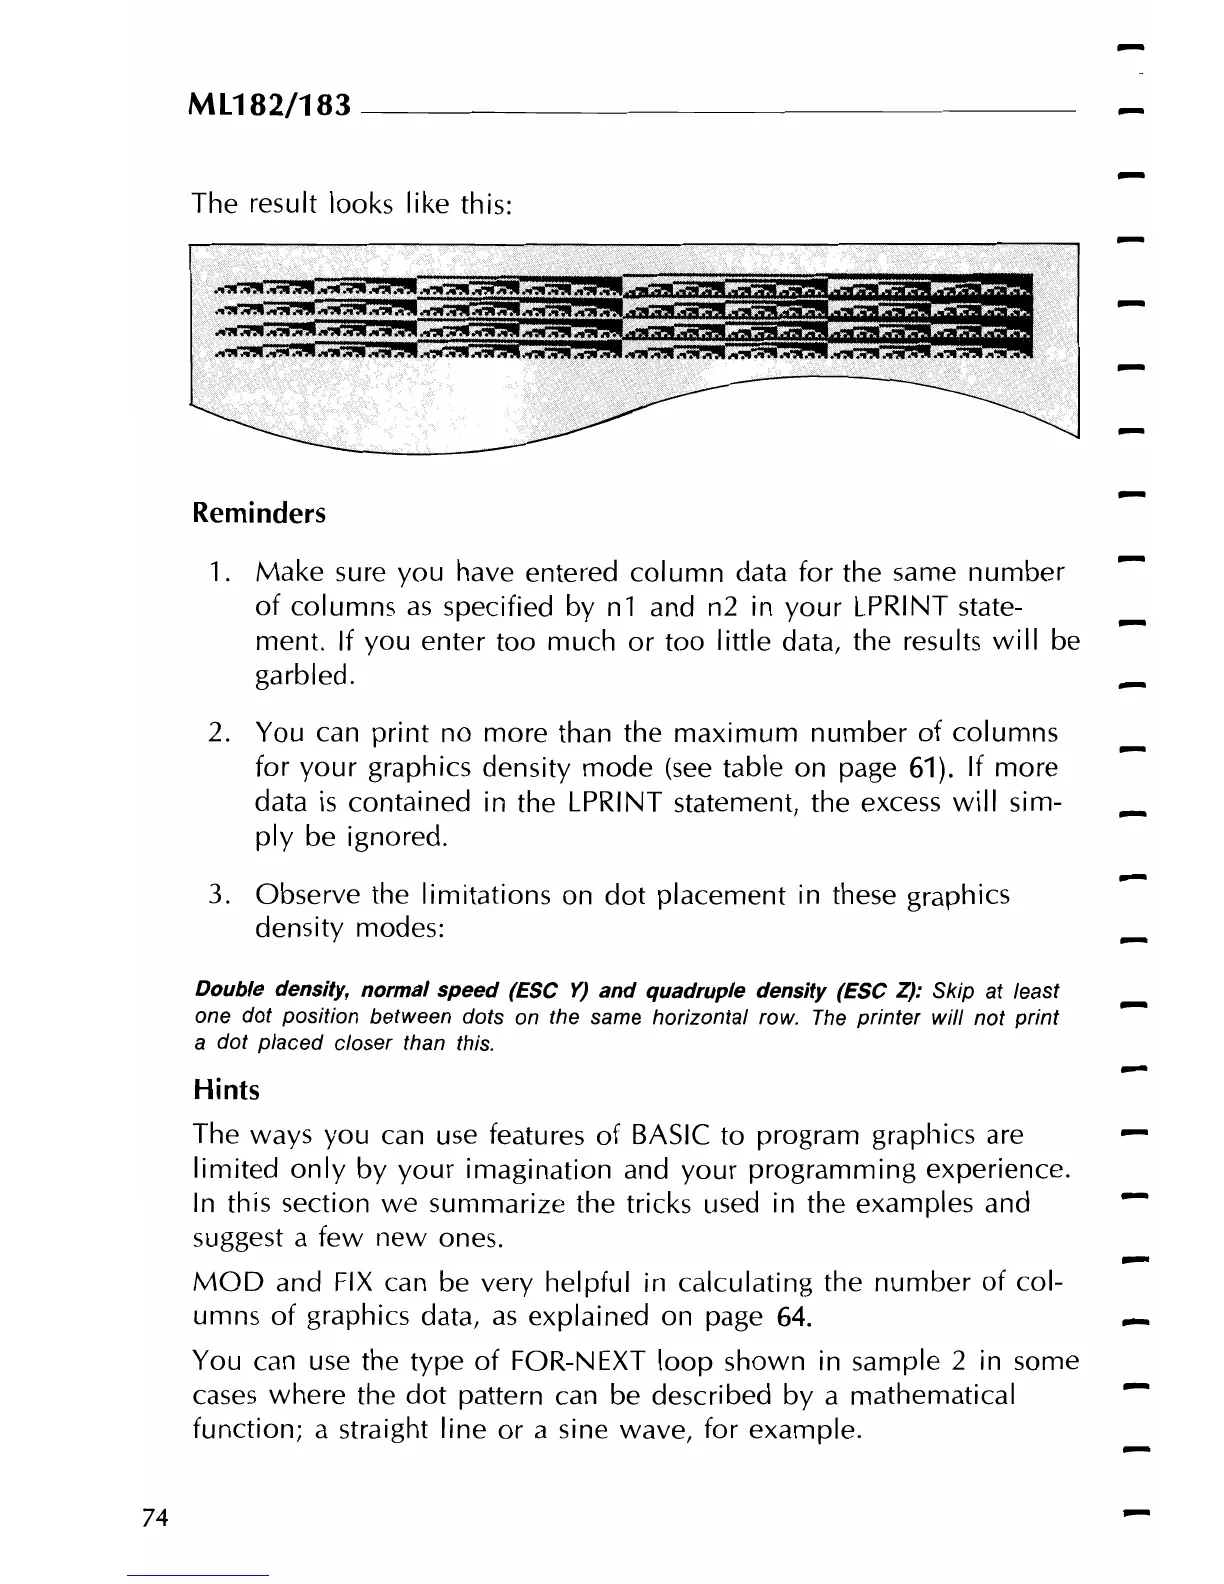
The result looks like this:
-
-
-
-
Reminders
1.
Make
sure you have entered
column
data for the same
number
-
of
columns
as
specified
by
n 1 and n2 in
your
LPRINT state-
ment. If you enter
too
much
or
too I ittle data, the results
wi
II
be
garbled.
2. You can
print
no more than the
maximum
number
of
columns
for
your
graphics density
mode
(see
table on page 61). If more
data
is
contained in the LPRINT statement, the excess
will
sim-
ply
be ignored.
3.
Observe the limitations on
dot
placement in these graphics
density modes:
Double density, normal speed
(ESC
Y)
and
quadruple density (ESC Z): Skip at least
one dot position between dots on the same horizontal row.
The
printer will not print
a dot placed closer than this.
Hints
The ways you can
use
features
of
BASIC to program graphics are
limited
only
by
your
imagination and
your
programming experience.
In
this section
we
summarize the tricks used in the examples and
suggest a few
new
ones.
MOD
and
FIX
can
be
very helpful in calculating the
number
of
col-
umns
of
graphics data,
as
explained on page
64.
-
You can
use
the type
of
FOR-NEXT
loop
shown in sample 2 in some
cases
where
the
dot
pattern can be described
by
a mathematical
function; a straight line
or
a sine wave, for example.
-
74