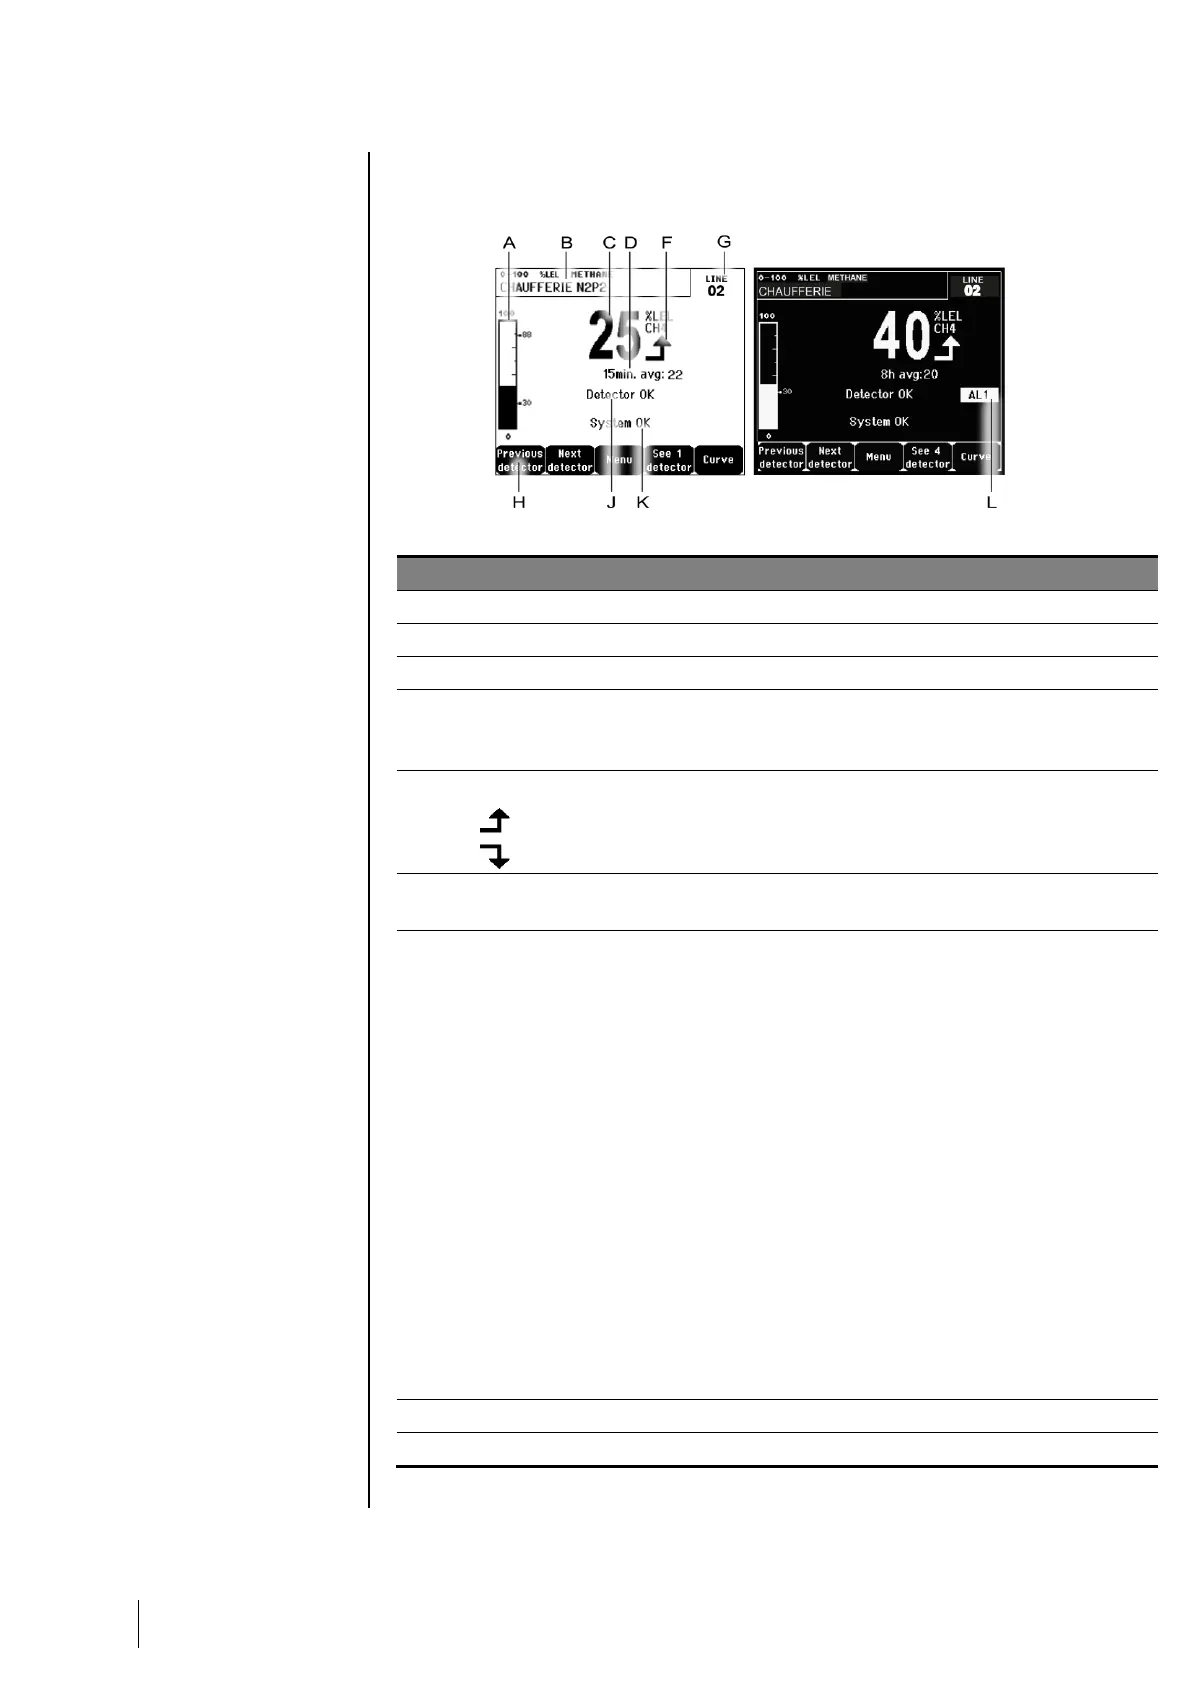
Value of the average measurement if this function has been activated via
the COM 32 application and depending on the display settings (see
Display Settings, on page 35).
Function keys.
■ Previous detector: Display of measurements of previous detector;
scanning of all the detectors on all the lines.
■ Next detector: Display of measurements of next detector; scanning of
all the detectors on all the lines.
■ Menu: Display of main menu See paragraph "Main menu" on page 35.
■ See 4 Detectors: Display of a group of 4 detectors (detector tag,
barograph with indication of alarms, value of current measurement with
unit and gas detected). Use the Page down or Page up keys to display
all of the next 4 detectors; passage to the next zone is automatic.
■ See 8 Detectors: Display of a group of 8 detectors (detector tag, value
of current measurement with unit and gas detected). Other buttons
similar to the selection. See 4 detectors.
■ See 1 detector: Display in normal mode (Figure 35).
■ Curve: Display of the measurement curves of the last 10 days (Figure
36). The
and
keys allow cursor displacement through the time
scale. The vertical dotted line displays the concentration and time stamp
of the point being considered. Escape: return to display of values.