44 MX43
User manual
Display in normal mode
Measurement Display
A B C. D E F.
G. H. J. K.
ECR_06_08
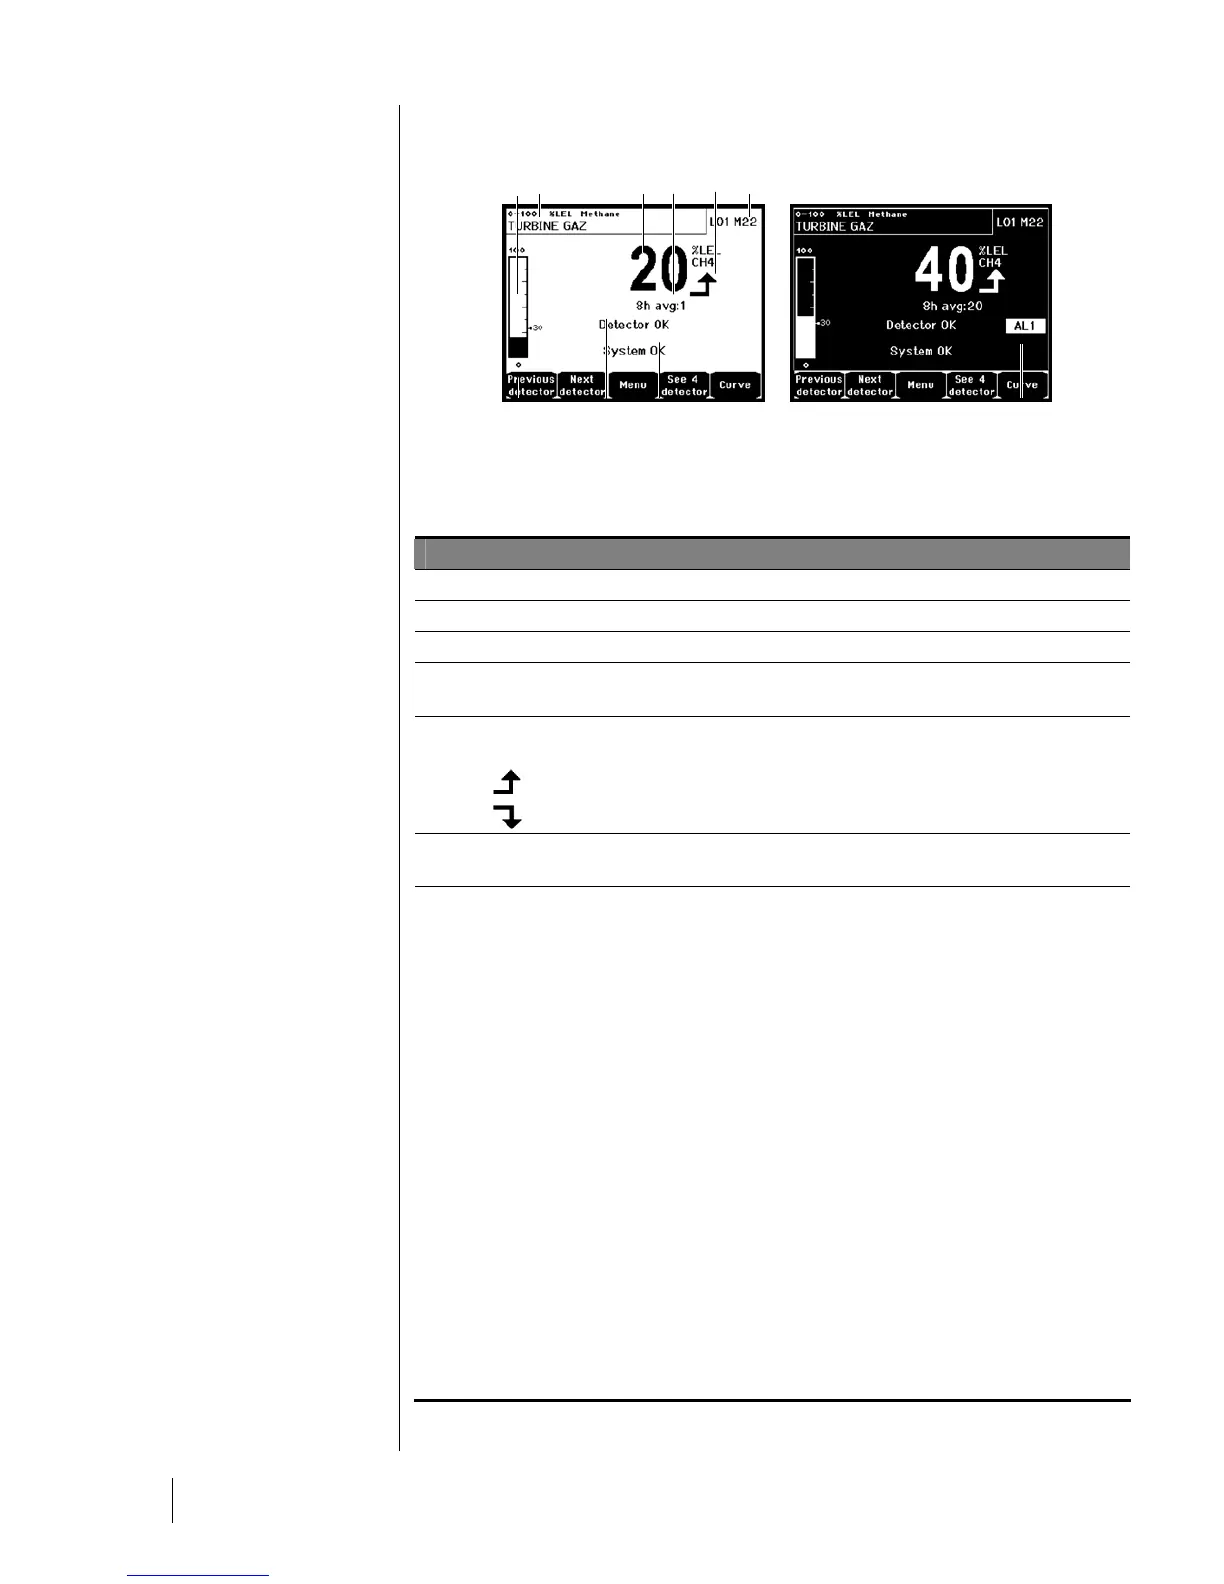
Figure 39: Example of the measurement display in normal mode and in inverse video.
Ref.
Significance
A.
Barograph with an indication of alarm limits.
B.
Measurement range, gas detected, and detector language.
C.
Value of the current measurement with the unit and gas detected.
D.
Value of the average measurement if the programming was carried out via
the COM 43 application.
E.
Indicator of measurement
trend
Ascending tendency
Descending tendency
F.
Address of digital detector on a digital line or channel number for a analog
detector
G.
Function keys.
■ Previous detector: Display of measurements of previous detector;
scanning of all the detectors on all
the lines.
■ Next detector: Display of measurements of next detector; scanning of
all the detectors on all
the lines.
■ Menu: Display of main menu See paragraph "Main menu" on page 46.
■ See 4 Detectors: Display of a group of 4 detectors (detector tag,
barograph with indication of alarms, value of current measurement with
unit and gas detected). Use the Page down or Page up keys to display
all of the next 4 detectors; passage to the next zone is automatic.
■ See 8 Detectors: Display of a group of 8 detectors (detector tag, value
of current measurement with unit and gas detected). Other buttons
similar to the selection. See 4 detectors.
■ See 16 Detectors: Display of a group of 16 detectors ( detector tag,
value of current measurement with unit and gas detected). Other buttons
similar to the selection. See 4 detectors.
■ See 1 detector: Display in normal mode (Figure 40).
■ Curve: Display of the measurement curves of the last 4 hours (Figure
41). The
and
keys allow cursor displacement through the time
scale. The vertical dotted line displays the concentration and time stamp
of the point being considered. Escape: return to display of values.