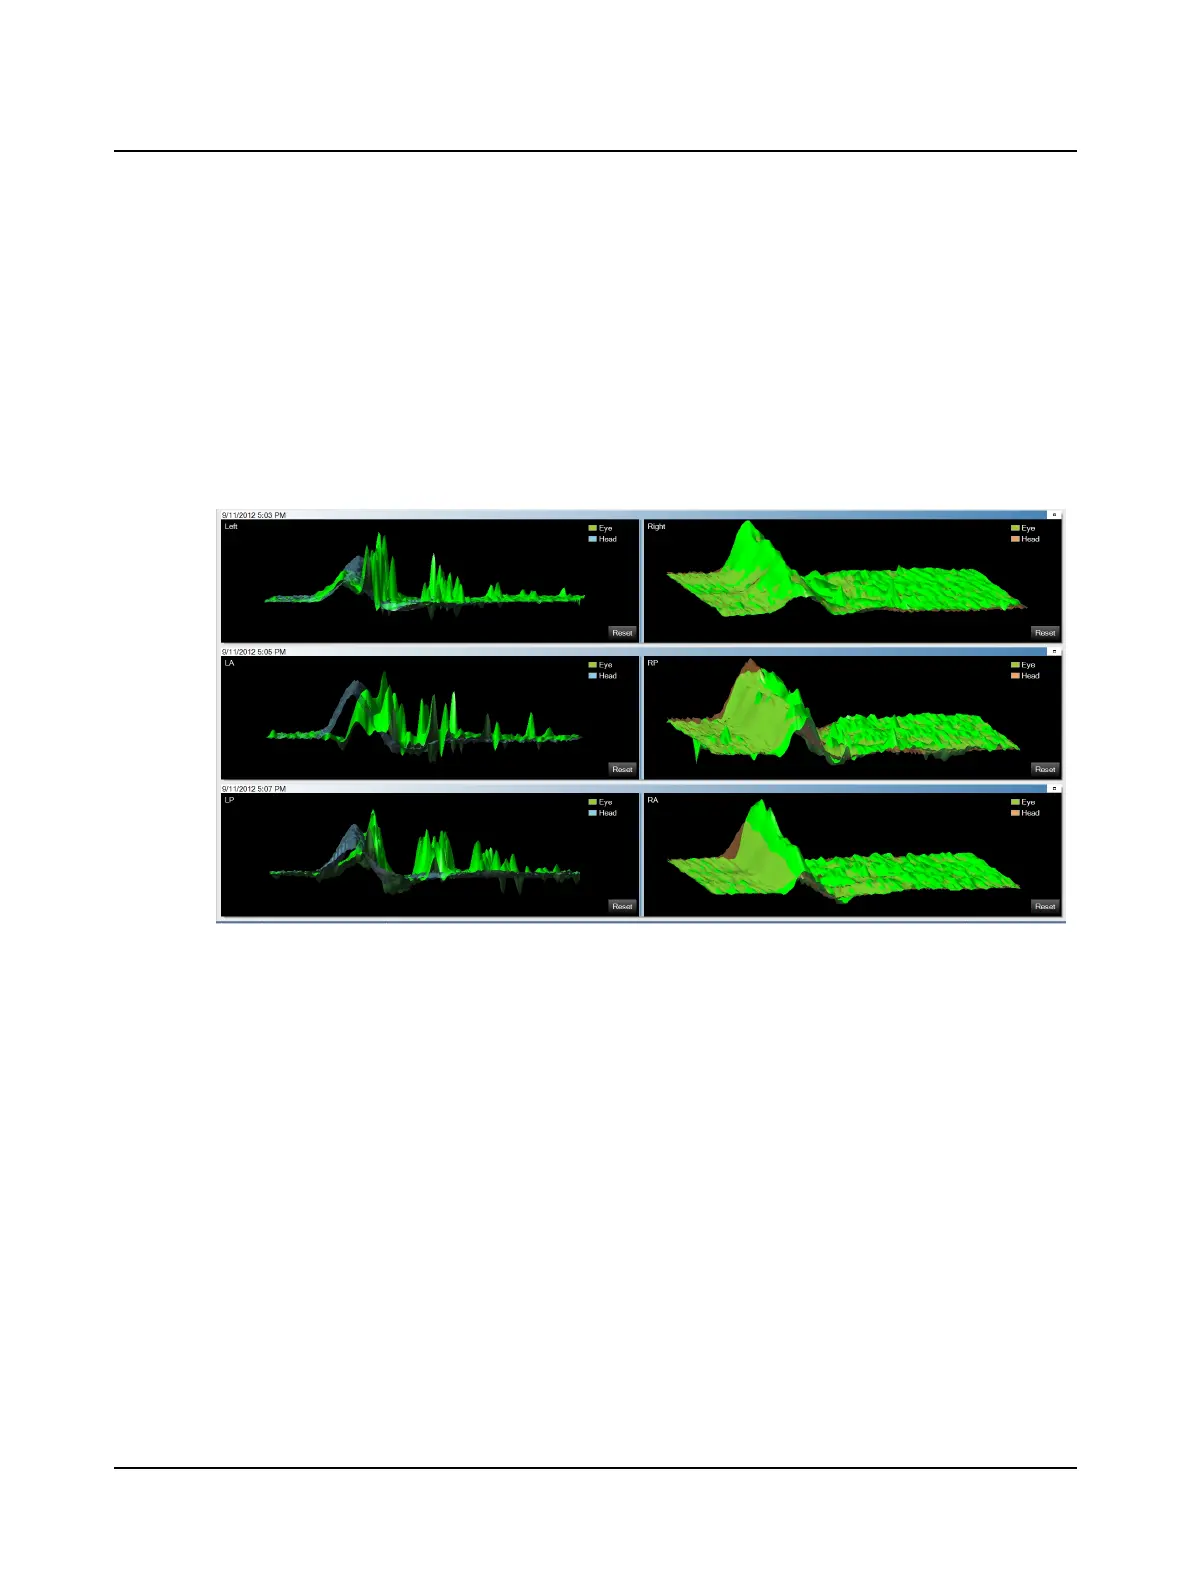
Progress Graphs
Four test sessions can be viewed together in this window. The 3D graphs display as described in 3D Analysis window ►
69 except that this window displays multiple tests. If more than 4 tests are chosen, a scroll bar will appear on the right to
move the window up and down.
Default colors for data shown in the graphs allow those who are color blind to easily distinguish the different colors. To
change the colors used for each type of data, click the Graph Colors window tab in the Options window. Refer to the
Reference Manual.
The default layout places the right graph (right head and eye velocity data) on the right and the left graph (left head and
eye velocity data) on the left. To switch the layout, click the Head Impulse window tab in the Options window and select
Display Left Graph on Right Side. Refer to the Reference Manual.
74 Otometrics - ICS Impulse USB
9 Head Impulse