#3 Plot Window
The original test data and the reference data are plotted, with time as the X axis and Y as the common unit of
measurement between the UUT and reference data. Evaluated plateaus are shown as boxes of varying colors over
the UUT data set.
#4 Residual Plot Window
After the data set has been evaluated, and the coefficients have been calculated, the user may plot the residual
data as means or at individual plot points, and display the residual values in the residual plateau table (Figure 5.8).
#5 Utility Settings
RHS Plateau settings. In order from left to right they are as follows:
• Plateau Time Range - The time over which a subset of data must be stable in order to be considered a
plateau. This is defined in Minutes(min) and Seconds(s).
• Ignore span - The amount of data rows the user wishes Plateau to ignore during the evaluation.
• Plateau Detection Sensitivity - Defines the ‘’acceptable limit of the plateau by evaluation of the standard
deviation.
• Evaluate - This button causes Plateau to evaluate the UUT data set and find the plateaus given the setting
mentioned previously. Plateau will then fill in the plateau table and create the small boxes around the
visual representation of the data.
• Equation Type Drop-Down – This drop-down menu allows selection of the curve fit equation to evaluate.
• Calculate – This button will calculate coefficients using an equation chosen within a drop-down menu.
• Save Coefficients – This button will allow the user to save the coefficients to a file name/directory chosen
by the user for future access.
• Plot Residuals – This will command Plateau to generate a plot of the predicted residuals generated from
the calculated coefficients.
10.2 SEQUENCE OF EVENTS
The following section dictates the sequence of events that you need to follow in order to utilize RHS Plateau.
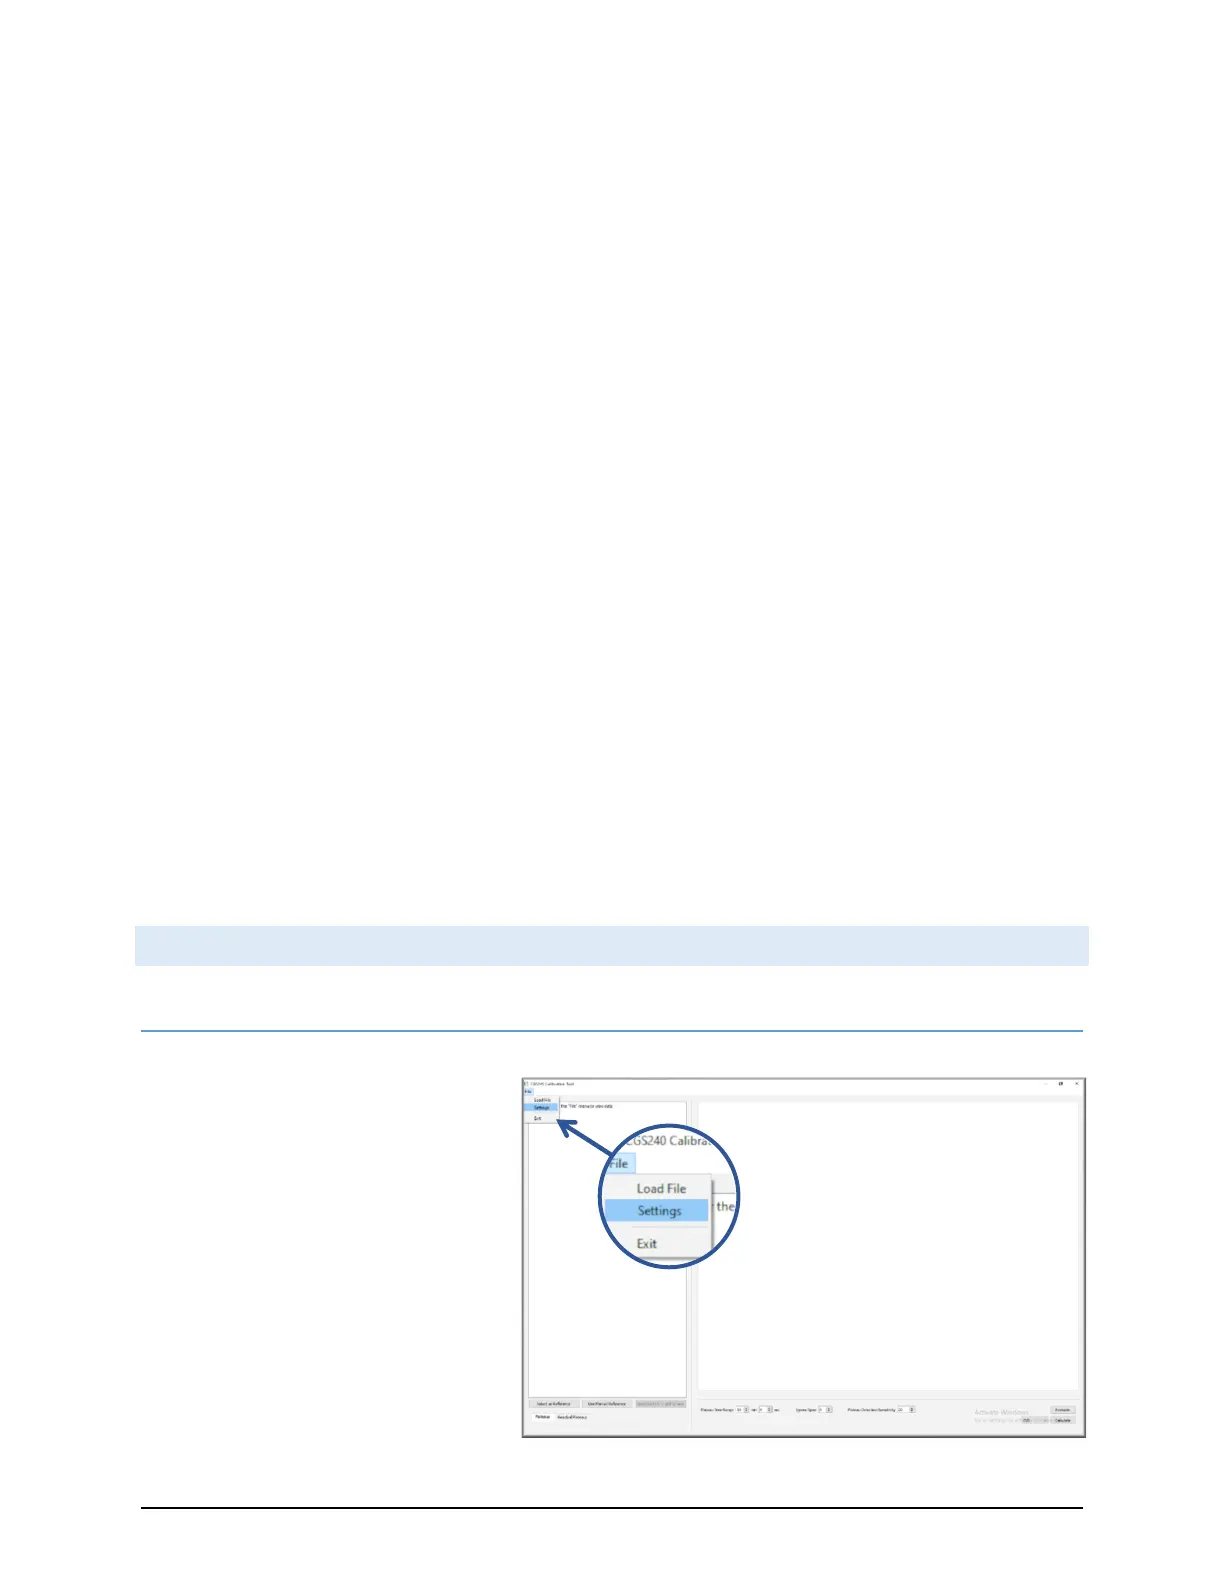
10.2.1 CONFIGURING SETTINGS
Before loading in data set files, be sure to
look over the settings menu (in the File
pull down menu) to confirm that your file
delimiter and datetime formats are
correct.
As shown in Figure 5.11, to display
settings, click on File > Settings.